 ConceptDraw Solution Park
ConceptDraw Solution Park collects graphic extensions, examples and learning materials
HelpDesk
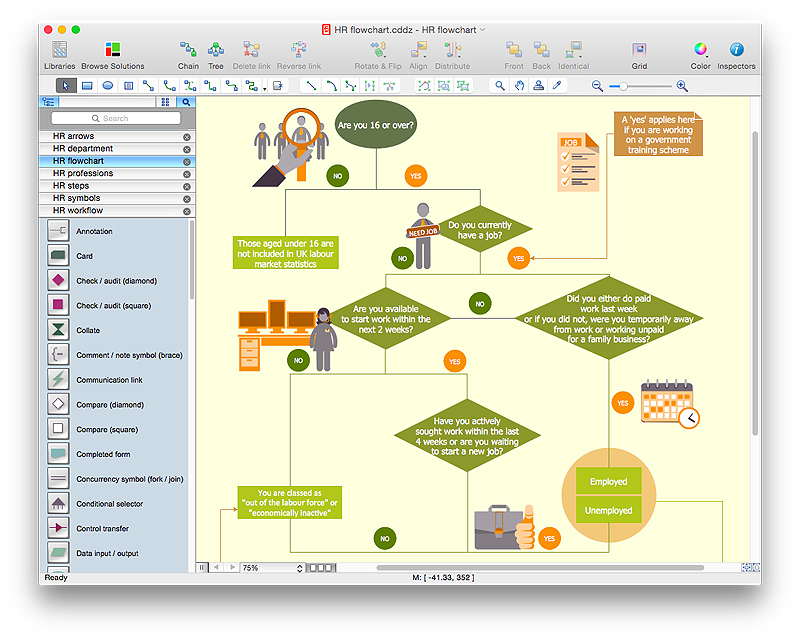
How to Create a HR Process Flowchart Using ConceptDraw PRO
One of the useful tools of each HR specialist is a HR Process Flowchart. HR Flowchart renders step-by-step the process of Human Resource management in any organization. HR flowchart shows the flow of all HR processes, identifies and standardizes the list of mandatory documents required for the implementation of all HR procedures, including the recruiting process. Usually, the descriptions of entire HR processes in a company requires a big set of graphic documents. They must be regularly redrawn to maintain up to date. The best tool for this is ConceptDraw PRO - the best software to create process flow diagrams of various types. In conjunction with ConceptDraw HR flowchart solution, it delivers comprehensive tool-set for human resource management.HelpDesk
How to Draw a Chemical Process Flow Diagram
Process Flow Diagram widely used in modeling of processes in the chemical industry. A Chemical Process Flow diagram (PFD) is a specialized type of flowchart. With the help of Chemical Process Flow Diagram engineers can easily specify the general scheme of the processes and chemical plant equipment. Chemical Process Flow Diagram displays the real scheme of the chemical process, the relationship between the equipment and the technical characteristics of the process. Chemical Process Flow Diagram illustrates the connections between the basic equipment as well as the overall structure of pipelines and other supporting equipment. The purpose of the PFD is to build the image of the basic idea of the chemical process. ConceptDraw PRO together with its Chemical and Process Engineering solution delivers the possibility to design Chemical Process Flow diagrams. It is designed for chemical industry engineers and designers.
 Event-driven Process Chain Diagrams
Event-driven Process Chain (EPC) Diagram is a type of flowchart widely used for modeling in business engineering and reengineering, business process improvement, and analysis. EPC method was developed within the Architecture of Integrated Information Systems (ARIS) framework.
HelpDesk
How to Create a Timeline Diagram in ConceptDraw PRO
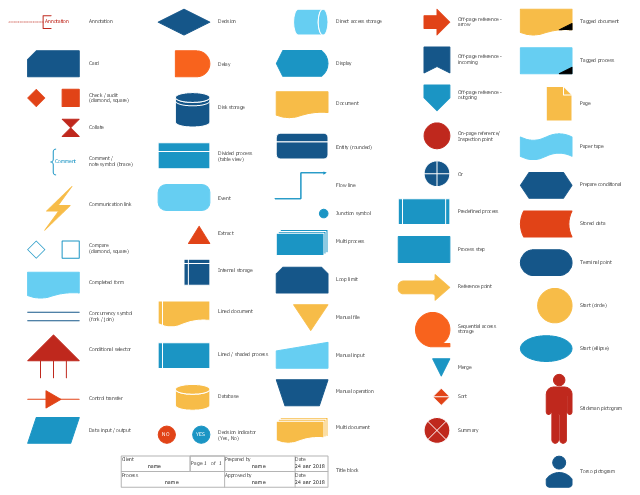
A Timeline is a chart which displays a project plan schedule in chronological order. A Timeline is used in project management to depict project milestones and visualize project phases, and show project progress. The graphic form of a timeline makes it easy to understand critical project milestones, such as the progress of a project schedule. Timelines are particularly useful for project scheduling or project management when accompanied with a Gantt chart. It captures the main of what the project will accomplish and how it will be done. making a project timeline is one of the most important skills a project manager needs have. Making comprehensive, accurate timelines allows you getting every project off in the best way. ConceptDraw PRO allows you to draw a timeline charts using special library.The vector stencils library "Sales flowchart" contains 62 flow chart symbols.
Use it to design your sales flowcharts, workflow diagrams and process charts by the ConceptDraw PRO diagramming and vector drawing software.
"Flowcharts are used in designing and documenting simple processes or programs. Like other types of diagrams, they help visualize what is going on and thereby help understand a process, and perhaps also find flaws, bottlenecks, and other less-obvious features within it. There are many different types of flowcharts, and each type has its own repertoire of boxes and notational conventions. The two most common types of boxes in a flowchart are:
(1) a processing step, usually called activity, and denoted as a rectangular box,
(2) a decision, usually denoted as a diamond." [Flowchart. Wikipedia]
The shapes example "Design elements - Sales flowchart" is included in the Sales Flowcharts solution from the Marketing area of ConceptDraw Solution Park.
- Sales Process Flowchart . Flowchart Examples | Sales Process Steps ...
- Process Flowchart | Sales Process Flowchart . Flowchart Examples ...
- Flowchart Marketing Process . Flowchart Examples | Sales ...
- Flowchart Marketing Process. Flowchart Examples | Sales Process ...
- Flowchart Marketing Process. Flowchart Examples | Sales Process ...
- Process Flowchart | Flow chart Example. Warehouse Flowchart ...
- Basic Flowchart Symbols and Meaning | Flowchart design ...
- Block diagram - Selling technology patent process | Sales Process ...
- Process Flowchart | Flow process chart | Flow chart Example ...
- What Is The Business Flow Chart Of Whole Sale Industry
- Process Flowchart | Cross-Functional Flowchart | Sales Process ...
- Contoh Flowchart | Flow chart Example. Warehouse Flowchart ...
- Invoice payment process - Flowchart | Accounting Flowchart ...
- Basic Flowchart Symbols and Meaning | Sales Process Flowchart ...
- Euclidean algorithm - Flowchart | Solving quadratic equation ...
- Flowchart Process
- Process Flowchart | Basic Flowchart Symbols and Meaning | Flow ...
- Flowchart Marketing Process . Flowchart Examples | Marketing Flow ...
- What is Interactive Flowcharts | Create Response Charts | How to ...


