HelpDesk
How To Create an Affinity Diagram Using ConceptDraw Office
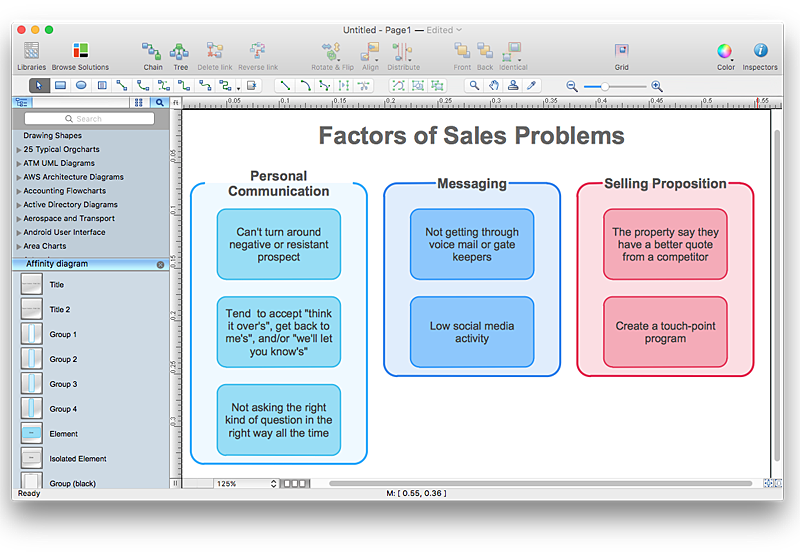
Affinity diagram is designed to prepare the data for further analysis of the cause-effect relationships.The Affinity diagram shows the structure of large, complex factors that have an influence on a problem, and then divides them up into a smaller and simpler structure. We recommend using a mind map for Brainstorming and collecting the factors affecting the problem. The ability to create an Affinity diagram from a mind map is supported by the ConceptDraw Seven Management and Planning Tools solution.
 Seven Management and Planning Tools
Seven Management and Planning Tools solution extends ConceptDraw PRO and ConceptDraw MINDMAP with features, templates, samples and libraries of vector stencils for drawing management mind maps and diagrams.
 Management Area
The solutions from Management area of ConceptDraw Solution Park collect templates, samples and libraries of vector stencils for drawing the management diagrams and mind maps.
HelpDesk
How to Manage Problem Solving Using Seven Management and Planning Tools
Stage by stage gouide on using visual tools to move toward solving the problem.
 ConceptDraw Solution Park
ConceptDraw Solution Park collects graphic extensions, examples and learning materials
- Affinity diagram - Implementing continuous process improvement ...
- Seven Management and Planning Tools | Business Productivity ...
- Affinity Diagram Software | Total Quality Management with ...
- Example Of Affinity Diagrams Relate To Tqm
- Affinity Diagram In Total Quality Management
- Affinity diagram - Implementing continuous process improvement
- New Seven Managnent Tools Diagram
- Seven Management and Planning Tools | Seven Management and ...
- Cause and Effect Analysis (Fishbone Diagrams ) | How To Create ...
- Seven Management and Planning Tools | Affinity diagram ...
- Seven Management and Planning Tools | TQM Diagram Tool ...
- TQM Diagram Example | TQM Diagram — Professional Total Quality ...
- Affinity Diagram | Seven Management and Planning Tools | PDPC ...
- PROBLEM ANALYSIS. Root Cause Analysis Tree Diagram | How to ...
- Social Media Response Management DFD Charts - software tools ...
- Affinity diagram - Implementing continuous process improvement ...
- TQM Software — Build Professional TQM Diagrams | TQM Diagram ...
- Management Tools — Total Quality Management | Seven ...
- Seven Management and Planning Tools | Total Quality Management ...
- Business Process Management | Total Quality Management TQM ...

