Seven Basic Tools of Quality — Quality Control
ConceptDraw PRO diagramming and vector drawing software extended with Seven Basic Tools of Quality solution from the Quality area of ConceptDraw Solution Park provides effective tools for quality control and helps design any types of quality-related diagrams.
 Seven Basic Tools of Quality
Manage quality control in the workplace, using fishbone diagrams, flowcharts, Pareto charts and histograms, provided by the Seven Basic Tools of Quality solution.
Seven Basic Tools of Quality - Fishbone Diagram
ConceptDraw PRO enhanced with Seven Basic Tools of Quality solution from the Quality area of ConceptDraw Solution Park is an ideal software for fast and easy drawing professional looking quality diagrams, including a Fishbone diagram.Seven Basic Tools of Quality - Pareto Chart
Pareto Chart design is now easier than ever thanks to the ConceptDraw PRO software and powerful drawing tools, 9 libraries with numerous vector objects, collection of professionally designed and well thought-out samples offered by Seven Basic Tools of Quality solution from the Quality area of ConceptDraw Solution Park.Probability Quality Control Tools
The Total Quality Management Diagram solution helps your organization visualize business and industrial processes. Create Total Quality Management diagrams for business process with ConceptDraw software.Seven Basic Tools of Quality - Histogram
A histogram is a chart which visually displays a distribution of numerical data. ConceptDraw PRO diagramming and vector drawing software offers a powerful Seven Basic Tools of Quality solution from the Quality area of ConceptDraw Solution Park which contains a set of useful tools for easy drawing Histogram and other quality related diagrams of any complexity.Quality Control Chart Software — ISO Flowcharting
Quality Control Chart Software (ISO Flowcharting) - ConceptDraw PRO extended with Total Quality Management TQM Diagrams Solution from the Quality Management Area is the best diagramming and vector drawing software that allows you to draw the quality control charts quick and easy. The quality control chart is a graphic that illustrates the accordance of processes or products to the intended specifications and degree of differences from them. Depending on what type of data you need analyze, there are used different types of quality control charts: X-bar charts, S charts, Np charts.Total Quality Management Value
The Total quality management (TQM) is an enterprise-wide method of continuous quality improvement of all organizational processes, including the enhancement of ability to deliver high-quality products and services to the customers. The TQM includes eight main elements, which have great value: customer-focused, process-centered, total employee involvement, integrated system, continual improvement, strategic and systematic approach, fact-based decision making, communications. ConceptDraw PRO diagramming and vector drawing software offers the Total Quality Management Diagram solution with effective drawing tools, predesigned vector elements, samples and templates that help easy design the Total Quality Management diagrams, TQM flowcharts and Mind Maps widely used in quality management projects to visualize the business processes and industrial processes for your organization, to demonstrate the quality control step-by-step in a visual manner, to compare visually the ideal and real stages of processes.Total Quality Management Business Diagram
The Total Quality Management Diagram solution helps you and your organization visualize business and industrial processes. Create Total Quality Management diagrams for business process with ConceptDraw software.TQM Diagram Tool
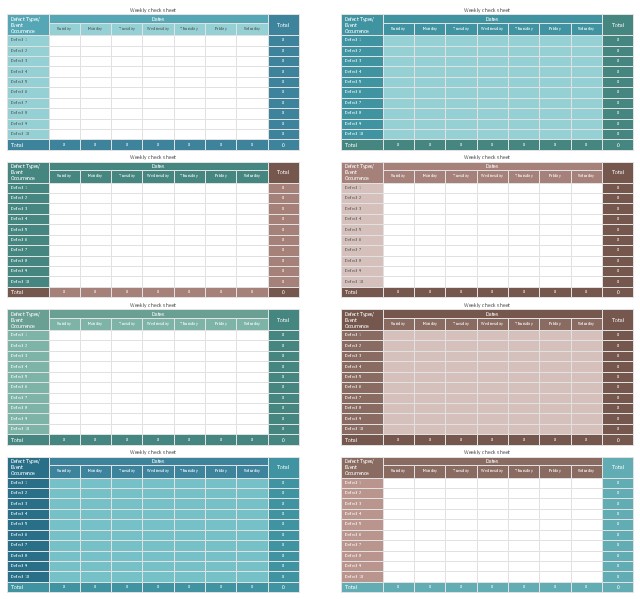
The Total Quality Management Diagram solution helps you and your organization visualize business and industrial processes. Create Total Quality Management diagrams for business process with ConceptDraw software.The vector stencils library "Check sheet" contains 8 templates of weekly check sheet.
Use it to design your check sheets with ConceptDraw PRO diagramming and vector drawing software.
"The check sheet is a form (document) used to collect data in real time at the location where the data is generated. The data it captures can be quantitative or qualitative. When the information is quantitative, the check sheet is sometimes called a tally sheet.
The check sheet is one of the so-called Seven Basic Tools of Quality Control." [Check sheet. Wikipedia]
The example of check sheet templates "Design elements - Check sheet" is included in the Seven Basic Tools of Quality solution from the Quality area of ConceptDraw Solution Park.
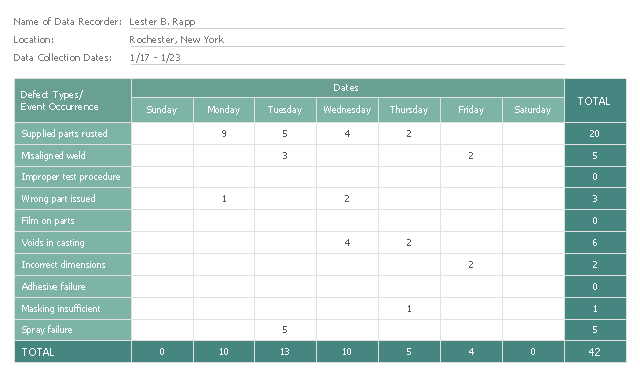
This check sheet example was redesigned from the Wikimedia Commons file: Check sheet for motor assembly.svg. [commons.wikimedia.org/ wiki/ File:Check_ sheet_ for_ motor_ assembly.svg]
This file is licensed under the Creative Commons Attribution-Share Alike 3.0 Unported license. [creativecommons.org/ licenses/ by-sa/ 3.0/ deed.en]
"The check sheet is a form (document) used to collect data in real time at the location where the data is generated. The data it captures can be quantitative or qualitative. When the information is quantitative, the check sheet is sometimes called a tally sheet.
The check sheet is one of the so-called Seven Basic Tools of Quality Control. ...
Kaoru Ishikawa identified five uses for check sheets in quality control:
- To check the shape of the probability distribution of a process
- To quantify defects by type
- To quantify defects by location
- To quantify defects by cause (machine, worker)
- To keep track of the completion of steps in a multistep procedure (in other words, as a checklist)" [. Wikipedia]
The example "Check sheet for motor assembly" was created using the ConceptDraw PRO software extended with the Seven Basic Tools of Quality solution from the Quality area of ConceptDraw Solution Park.
Used Solutions
Quality
>
Cause and Effect Diagrams
Cause and Effect Diagrams are designed to identify the potential factors that cause an overall effect. The causes are grouped into the categories, each cause is a source of variation. ConceptDraw PRO powerful diagramming and vector drawing software provides the Fishbone Diagrams solution from the Management area of ConceptDraw Solution Park that allows to design the Cause and Effect Diagrams quick, easy and effective.Line Chart Examples
The Line Graphs solution from Graphs and Charts area of ConceptDraw Solution Park contains a set of examples, templates and design elements library of line and scatter charts. Use it to draw line and scatter graphs using ConceptDraw PRO diagramming and vector drawing software for illustrating your documents, presentations and websites.- Check sheet for motor assembly | Seven Basic Tools of Quality ...
- Seven Basic Tools of Quality | Seven Basic Tools of Quality - Quality ...
- Fishbone Diagrams | Seven Basic Tools of Quality | Seven Basic ...
- Total Quality Management Value | Probability Quality Control Tools ...
- Design elements - Check sheet | Seven Basic Tools of Quality ...
- Seven Basic Tools of Quality - Fishbone Diagram | Seven Basic ...
- Probability Quality Control Tools | Quality Control Chart Software ...
- TQM Diagram Tool | Probability Quality Control Tools | Seven Basic ...
- Seven Basic Tools of Quality - Quality Control | Seven Basic Tools of ...
- Probability Quality Control Tools | Process Flowchart | Basic ...
- Process Flowchart | Quality Control Chart Software — ISO ...
- Seven Basic Tools of Quality - Quality Control | Probability Quality ...
- Probability Quality Control Tools | TQM Diagram Tool | Seven Basic ...
- Probability Quality Control Tools | Basic Flowchart Symbols and ...
- Seven Basic Tools of Quality - Histogram | Seven Basic Tools of ...
- New Seven Basic Tools of Quality Solution for ConceptDraw PRO
- Quality Control Chart Software — ISO Flowcharting | Seven Basic ...
- Process Flowchart | Probability Quality Control Tools | Total Quality ...
- Scatter Diagrams | Seven Basic Tools of Quality - Quality Control ...


