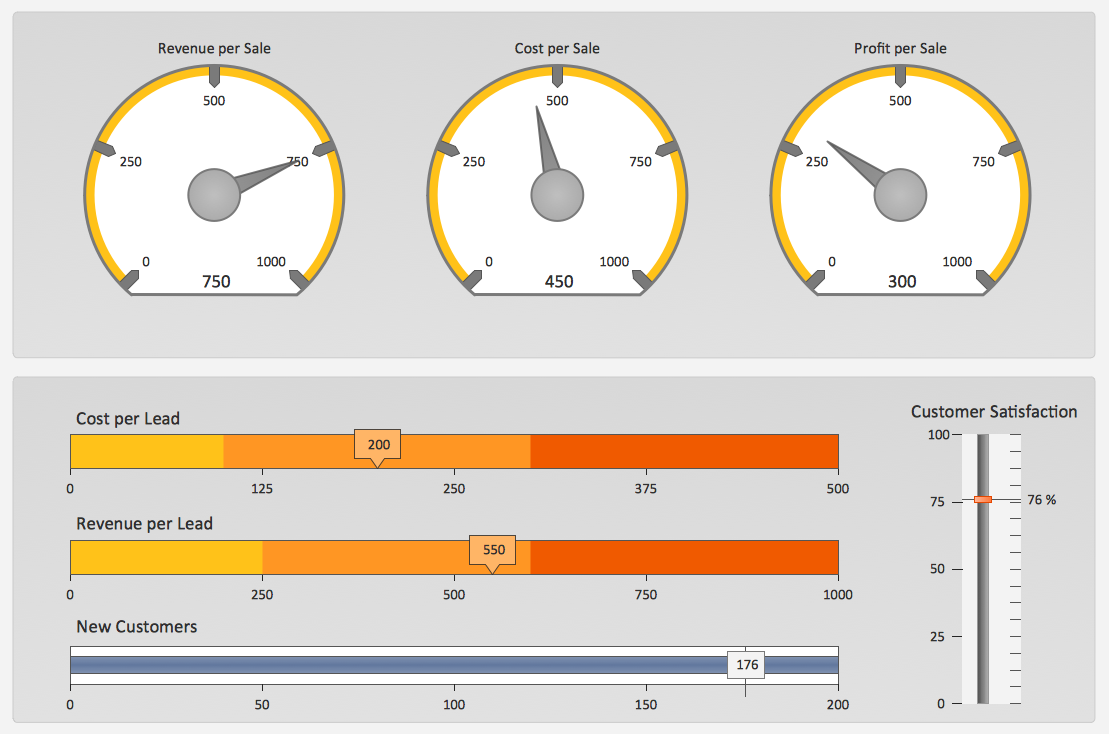
Sales Dashboard Template
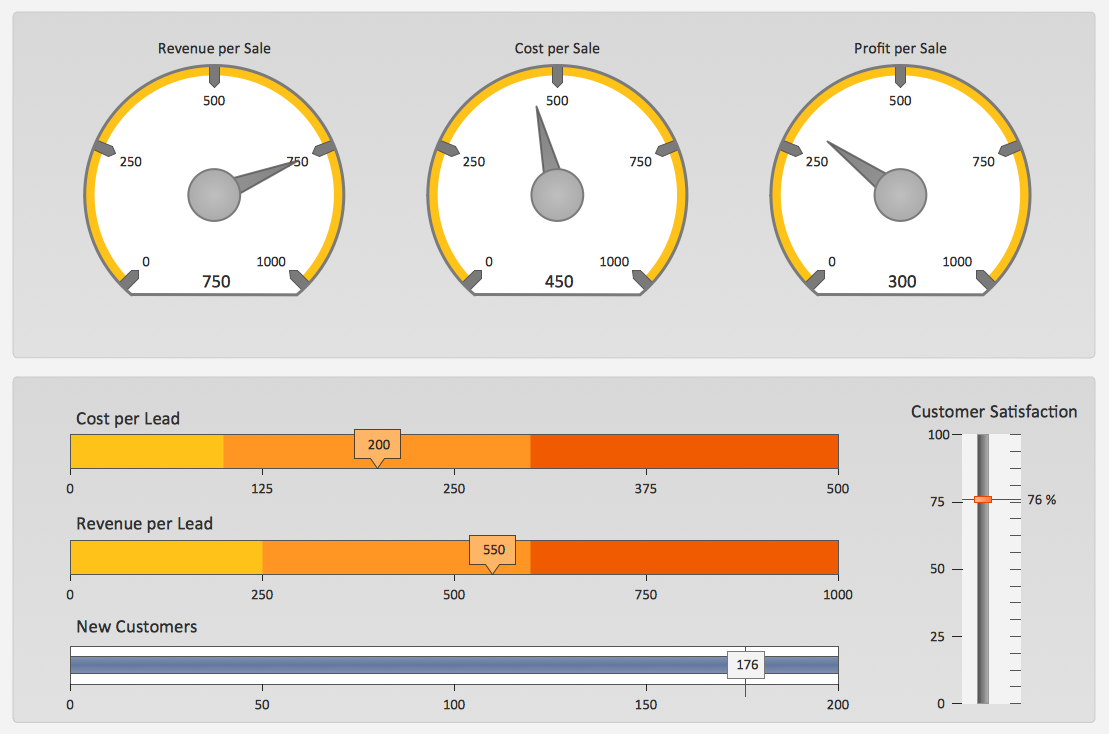
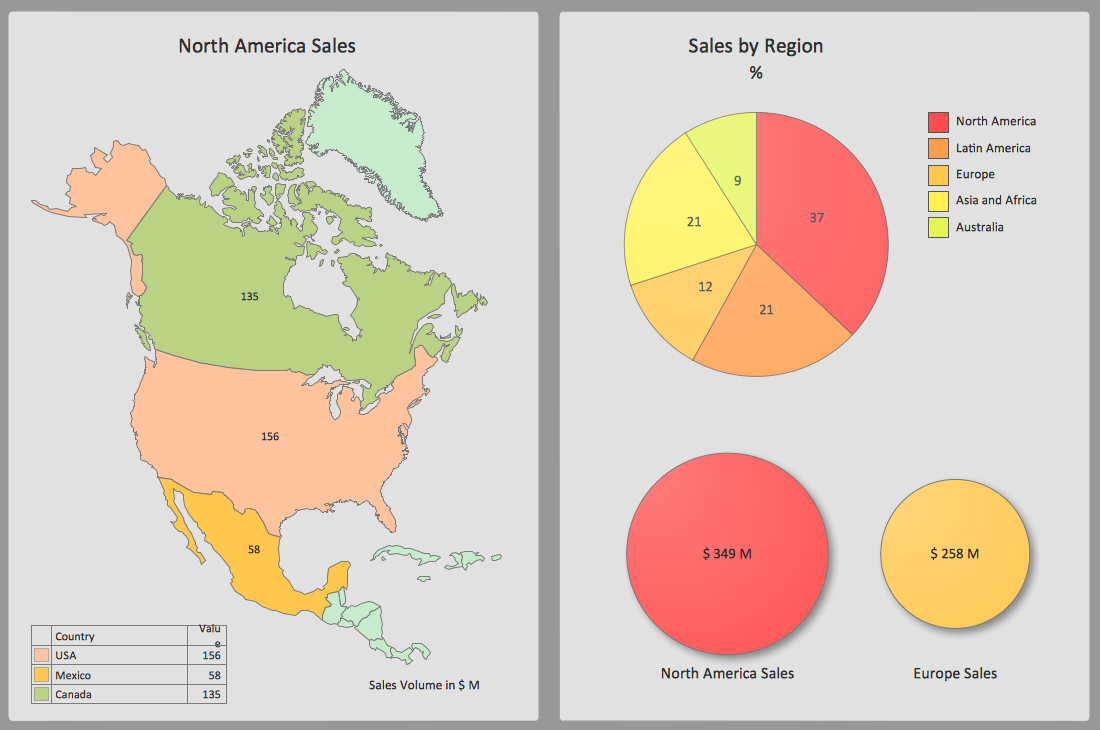
ConceptDraw PRO software extended with the Sales Dashboard solution delivers a complete set of samples, templates and pre-designed objects you need for visualizing sales data.
 Business Intelligence Dashboard
Business Intelligence Dashboard solution extends the ConceptDraw PRO v11 functionality with exclusive tools, numerous ready-to-use vector objects, samples and quick-start templates for creation professional Business Intelligence Dashboards, Business Intelligence Graphics, Business Intelligence Charts and Maps of different kinds. Design easy the BI dashboard, BI model or Dynamic chart in ConceptDraw PRO to monitor the company's work, to track the indicators corresponding your company's data, to display and analyze key performance indicators, to evaluate the trends and regularities of the processes occurring at the company.
Data Visualization Software Solutions
To see how your business can improve you can try data visualization software solutions that allows you visualize all your sales KPI in one sales dashboard allows you monitor and analyse sales activities.Sales Dashboard Examples
Visualizing sales data you may need a good example to start. ConceptDraw Sales Dashboard solution delivers a complete set of templates and samples you can use as examples to start composing your own sales dashboard.Dashboard
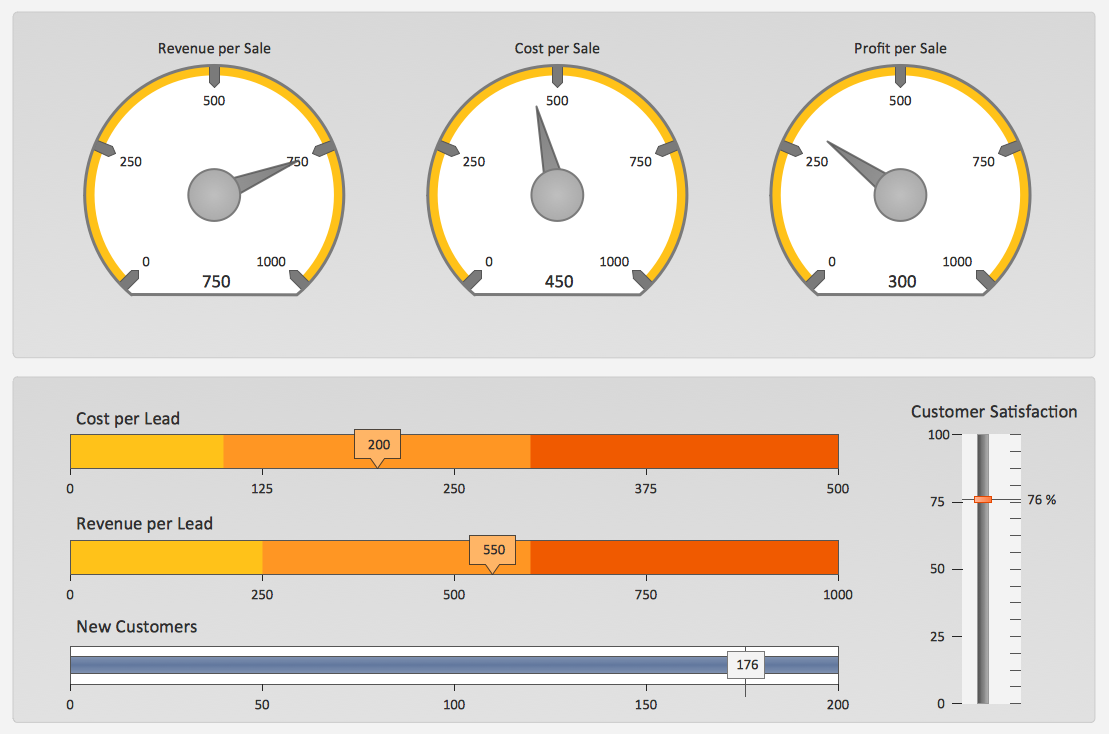
ConceptDraw PRO extended with Sales Dashboard solution from the Marketing area of ConceptDraw Solution Park is a perfect software for creating the live dashboard for the business data and progress visualization.Sales KPI Dashboards
A combination of sales KPI on a one dashboard helps you track sales activities and results. Visualizing sales data using ConceptDraw PRO software extended with the Sales Dashboard solutiongives you flexibility in choosing and tuning KPIs.Customer Relationship Management
Customer relationship management is an important component of sales success. Visualizing sales data you may put some KPI related to customers relationship management to your Sales dashboard and track this important aspect in real time.
 ConceptDraw Dashboard for Facebook
ConceptDraw Dashboard for Facebook solution extends ConceptDraw PRO software with a dynamically updated visual dashboard, which shows lifetime total likes, daily friends of fans, and daily page views, information you can receive from Facebook Insights.
Sales Dashboard - Access Anywhere
ConceptDraw Sales Dashboard is an automatically updated sales dashboard you can customize to see KPI you need. You can access sales dashboard anywhere to get fresh data and use any minute to see how your business can improve.Sales Dashboards for Your Company
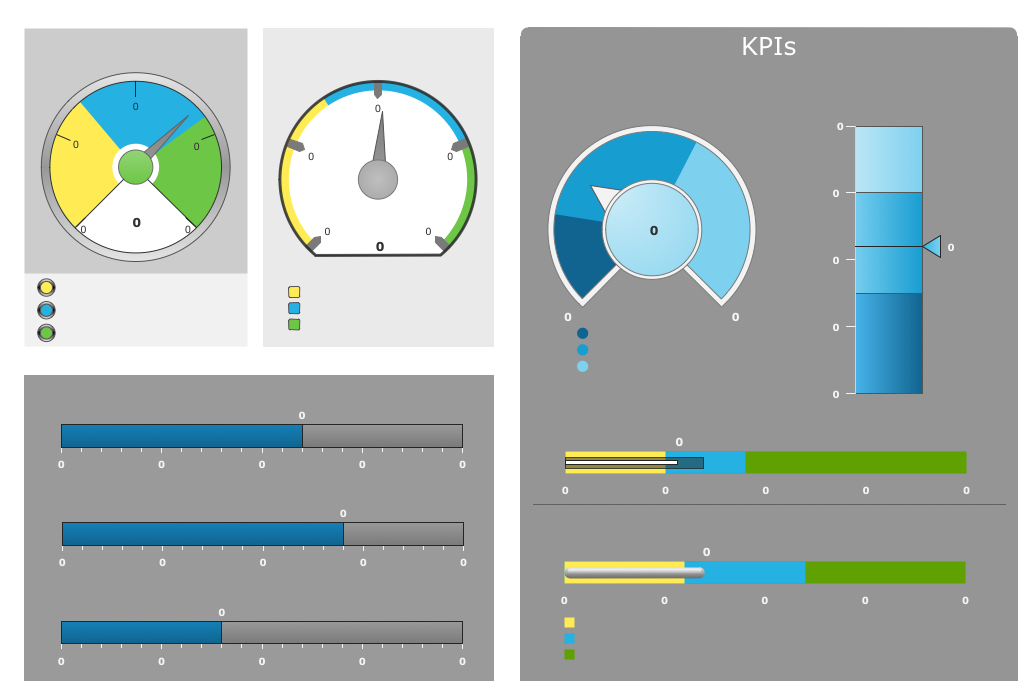
ConceptDraw PRO software extended with the Sales Dashboard solution allows you produce sales dashboards for your company easily. You can start from samples and templates delivered with the solution and then modify them to get a dashboard that suites your specific needs.Empower Your Sales Team With a Sales Dashboard
ConceptDraw Sales Dashboard solution allows you empower your sales team with a sales dashboard that visualizes all team and personal KPI your team need to work effectively.A KPI Dashboard
Composing a dashboard from different KPI is a kind of art. Visualizing sales data you have to keep balance to keep your dashboard informative, not messy. ConceptDraw Sales Dashboard solution gives you a set of good examples of balanced dashboards.HelpDesk
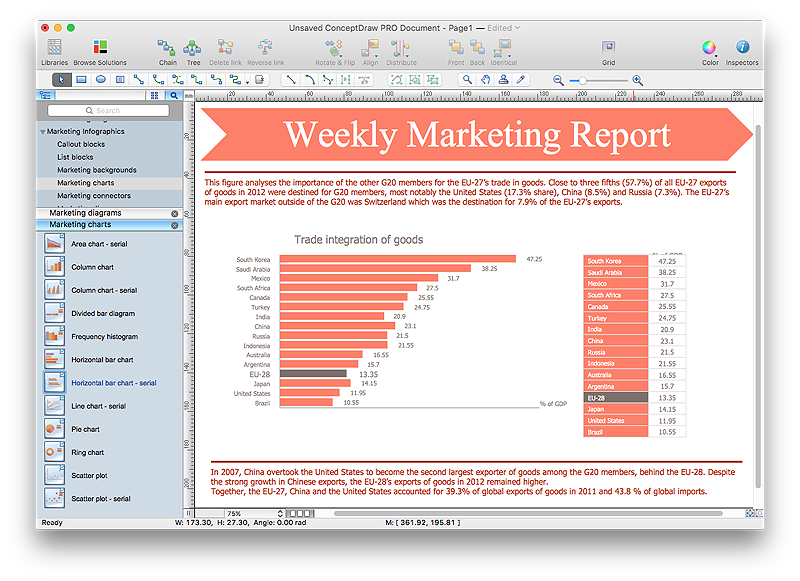
How to Create the Custom Diagram Template on Mac
ConceptDraw PRO enables you to place your own templates. You can create diagram with ConceptDraw PRO using your custom Template. You can set up your Template as a default ConceptDraw PRO start page. A template diagram is a drawing that serves as a starting point for a new graphic document. When you open a template, it is pre-formatted in some way. For example, you might use template that is formatted as an organizational chart. The template would likely have a workspace and a corresponding object libraries. When you save a file created with a template, you are usually prompted to save a copy of the file, so that you don't save over the template. Templates can either come with a proper solution or can be created by the user. If you find yourself creating similar documents over and over again, it might be a good idea to save one of them as a template. Then you won't have to format your documents each time you want to make a new one. Just open the template and start from there.Business Graphics Software
ConceptDraw PRO is a business graphics software that allows you improve your business using Sales Performance Dashboard helps you analyze your data more efficiently.KPI Dashboard
ConceptDraw PRO diagramming and vector drawing software supplied with Sales Dashboard solution from the Marketing area of ConceptDraw Solution Park provides the full set of useful tools which make it the best for producing the live KPI Dashboard of any complexity.- Sales Dashboard | Business Productivity Area | Excel Kpi ...
- Comparison Dashboard | Competitor Analysis | Business ...
- KPI Dashboard | Business Graphics Software | Time Series ...
- What is a Dashboard Area | Dashboard Software | Business ...
- How To Create Project Report | Business Intelligence Dashboard ...
- Free Dashboard Templates Powerpoint
- Sales Dashboard Template | Dashboard | Empower Your Sales ...
- Sales Dashboard Template | Sales KPI Dashboards | Visualize ...
- Sales Business Development Strategy Plan Template
- Meter Dashboard | Business Productivity Area | Transport Kpi ...
- Project task status dashboard - Template | Sales Dashboard ...
- Online Collaboration via Skype | HVAC Business Plan | Sales ...
- Performance Dashboard Templates
- Time Series Dashboard | Time series dashboard - Template | Time ...
- Time series dashboard - Template | Competitor Analysis | Process ...
- Sales Dashboards for Your Company | A KPI Dashboard | Sales ...
- Template For Sales Report Ppt
- Sales Dashboard Template | KPI Dashboard | Sales KPI ...
- Customer Relationship Management | Dashboard | Balanced ...
