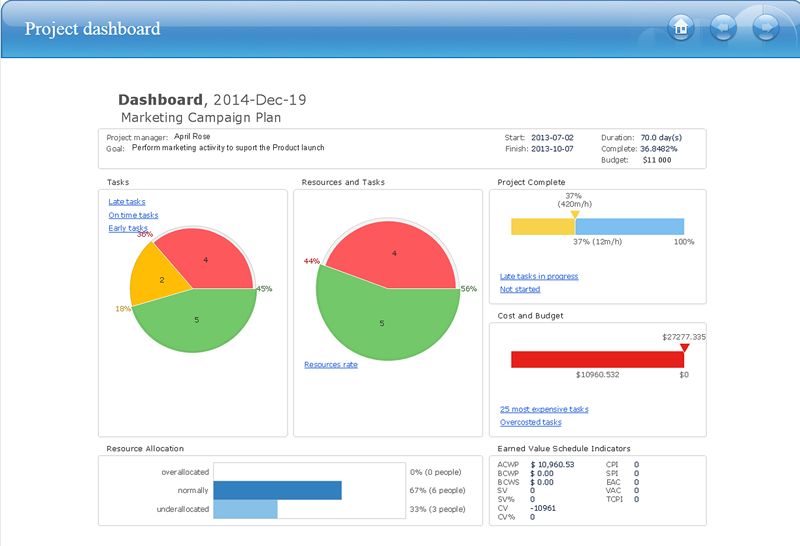
 Status Dashboard
Status dashboard solution extends ConceptDraw PRO software with templates, samples and vector stencils libraries with graphic indicators for drawing the visual dashboards showing status data.
 Composition Dashboard
Composition dashboard solution extends ConceptDraw PRO software with templates, samples and vector stencils library with charts and indicators for drawing visual dashboards showing data composition.
 Website Wireframe
The innovative Website Wireframe solution enhances the ConceptDraw PRO v10 functionality with newest wireframe tools, libraries with variety of predesigned icons, symbols, buttons, graphics, forms, boxes, and many other vector elements, templates and professionally designed samples, which make it the best wireframing software. Website Wireframe solution gives you significant advantages when designing and maintaining websites, creating skeletal and content-free depictions of website structure, making website prototypes and planning the content arrangement before committing to design, also speeds up the processes of sketching, producing and sharing wireframe examples of website style and interface design.
 ConceptDraw Dashboard for Facebook
ConceptDraw Dashboard for Facebook solution extends ConceptDraw PRO software with a dynamically updated visual dashboard, which shows lifetime total likes, daily friends of fans, and daily page views, information you can receive from Facebook Insights.
HelpDesk
How to Publish Project Reports on the Web Using ConceptDraw PRO
Reporting is an important part of project management. Every project manager is regularly asked how the project is progressing. ConceptDraw Office offers different ways in which to provide a project status.
 Business Intelligence Dashboard
Business Intelligence Dashboard solution extends the ConceptDraw PRO v11 functionality with exclusive tools, numerous ready-to-use vector objects, samples and quick-start templates for creation professional Business Intelligence Dashboards, Business Intelligence Graphics, Business Intelligence Charts and Maps of different kinds. Design easy the BI dashboard, BI model or Dynamic chart in ConceptDraw PRO to monitor the company's work, to track the indicators corresponding your company's data, to display and analyze key performance indicators, to evaluate the trends and regularities of the processes occurring at the company.
KPI Dashboard
ConceptDraw PRO diagramming and vector drawing software supplied with Sales Dashboard solution from the Marketing area of ConceptDraw Solution Park provides the full set of useful tools which make it the best for producing the live KPI Dashboard of any complexity.
 Meter Dashboard
Meter dashboard solution extends ConceptDraw PRO software with templates, samples and vector stencils library with meter indicators for drawing visual dashboards showing quantitative data.
 Azure Architecture
Create Microsoft Azure architecture diagrams using icons and templates regarding Azure management, Azure storage and Azure services.
 ConceptDraw Solution Park
ConceptDraw Solution Park collects graphic extensions, examples and learning materials
 Sales Dashboard
Sales Dashboard solution extends ConceptDraw PRO software with templates, samples and library of vector stencils for drawing the visual dashboards of sale metrics and key performance indicators (KPI).
What is a KPI?
What is a KPI? Key performance indicators (KPIs) represent a set of measures that are focused on the aspects of organizational performance which are the most important for its current and future success. ConceptDraw PRO diagramming and vector drawing software enhanced with Sales Dashboard solution from the Marketing area of ConceptDraw Solution Park allows effectively develop, analyze and improve your business thanks to the excellent possibility of monitoring all KPIs on one screen in a real time.HelpDesk
How to Connect Text Data to a Time Series Chart on Your Live Dashboard
Time Series Dashboard means an integration of some type of diagrams: Line Charts, Bar Charts, Column Charts, and Dot Plots on a single space. The ConceptDraw Time Series Dashboard solution can be used to create the interactive Time Series dashboard. The libraries of Time Series Charts solution contain the Live Objects, that can change their appearance depending on the external data. Each chart from the Time Series dashboard displays particular source data. You can include Time Series Charts in your business or technical dashboards to show and compare the items changing over time.
 Spatial Dashboard
Spatial dashboard solution extends ConceptDraw PRO software with templates, samples and vector stencils libraries with thematic maps for drawing visual dashboards showing spatial data.
 Fire and Emergency Plans
This solution extends ConceptDraw software with samples, templates and design elements for drawing the Fire and Emergency Plans.
- Website Template Circles Indicators
- Product Comparison Dashboard Template Website
- Website traffic dashboard | Website metrics - Visual dashboard ...
- Project task status dashboard - Template | Sales Dashboard ...
- Sales Dashboard Template | Dashboard | Empower Your Sales ...
- Website metrics - Visual dashboard | Website traffic dashboard ...
- Website Dashboard Infographics
- Dashboard Graphics Website
- Graph Chart Website Template
- Project task status dashboard - Template | Status Dashboard ...
- Correlation Dashboard | Website traffic dashboard | Business ...
- KPIs and Metrics | Sales metrics and KPIs - Visual dashboard | Meter ...
- Powerpoint Dashboard Template
- Sales Dashboard Template | Project task status dashboard ...
- Website KPIs - Visual dashboard | A KPI Dashboard | Sales KPIs ...
- Status Dashboard | Project task status dashboard - Template ...
- Sales Dashboard Examples | KPI Dashboard | Sales Dashboard ...
- Composition Dashboard | Composition dashboard - Template ...
- Learning Dashboard Template


