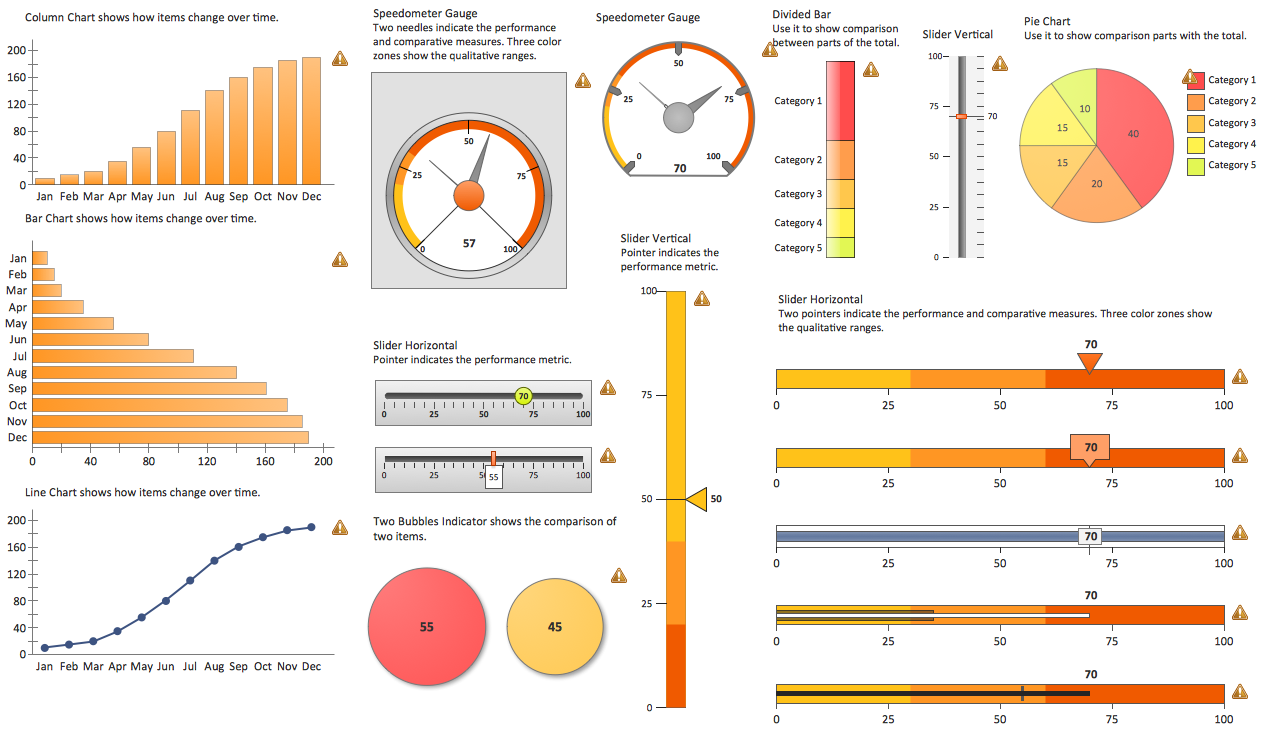
Sales Dashboard - Access Anywhere
ConceptDraw Sales Dashboard is an automatically updated sales dashboard you can customize to see KPI you need. You can access sales dashboard anywhere to get fresh data and use any minute to see how your business can improve.Business Intelligence Dashboard Software
ConceptDraw PRO is a business intelligence dashboard software that allows you produce sales dashboard that suites your specific needs. To see how your business can improve with sales dashboards select KPI and start tracking it.Sales Dashboards for Your Company
ConceptDraw PRO software extended with the Sales Dashboard solution allows you produce sales dashboards for your company easily. You can start from samples and templates delivered with the solution and then modify them to get a dashboard that suites your specific needs.
 Fishbone Diagram
Fishbone Diagrams solution extends ConceptDraw PRO software with templates, samples and library of vector stencils for drawing the Ishikawa diagrams for cause and effect analysis.
 Business Process Diagrams
The Business Process Diagram Solution extends ConceptDraw PRO v10 BPMN software with its RapidDraw interface, templates, samples, and libraries based on the BPMN 1.2 and BPMN 2.0 standards. This powerful solution permits you to visualize easily both simple and complex processes, as well as design business models. The Business Process Diagram solution allows one to quickly develop and document in detail any business processes at any stage of a project’s planning and implementation.
 Entity-Relationship Diagram (ERD)
Entity-Relationship Diagram (ERD) solution extends ConceptDraw PRO software with templates, samples and libraries of vector stencils from drawing the ER-diagrams by Chen's and crow’s foot notations.
 Cross-Functional Flowcharts
Cross-functional flowcharts are powerful and useful tool for visualizing and analyzing complex business processes which requires involvement of multiple people, teams or even departments. They let clearly represent a sequence of the process steps, the order of operations, relationships between processes and responsible functional units (such as departments or positions).
 ConceptDraw Solution Park
ConceptDraw Solution Park collects graphic extensions, examples and learning materials
 Accounting Flowcharts
Accounting Flowcharts solution extends ConceptDraw PRO software with templates, samples and library of vector stencils for drawing the accounting flow charts.
 Computer Network Diagrams
Computer Network Diagrams solution extends ConceptDraw PRO software with samples, templates and libraries of vector stencils for drawing the computer network topology diagrams.
 Engineering
This solution extends ConceptDraw PRO v9.4 with the ability to visualize industrial systems in electronics, electrical, chemical, process, and mechanical engineering.
 Universal Diagramming Area
This area collects solutions for drawing diagrams, charts, graphs, matrices, geographic and road maps for education, science, engineering, business.
- Business Graphics Software | Data Visualization Software Solutions ...
- Business Graphics Software | Meter Dashboard | Sales Dashboards ...
- Sales Dashboards for Your Company | Frequency Distribution ...
- Sales Dashboard - Access Anywhere | Sales Dashboards for Your ...
- Business Intelligence Dashboard Software | Meter Dashboard ...
- Business Intelligence Dashboard Software | What is a Dashboard ...
- Sales Dashboard - Access Anywhere | Dashboard Software ...
- Sales Dashboard - Access Anywhere | Sales Dashboard Template ...
- Meter Dashboard | What is a Dashboard Area | Business Graphics ...
- What is a Dashboard Area | Design elements - Sales dashboard ...
- Customer Relationship Management | Sales Dashboard - Access ...
- Sales Dashboard Examples | Meter Dashboard ... - Conceptdraw.com
- A KPI Dashboard | A KPI Dashboard Provides the Answers Your ...
- PM Dashboards | What is a Dashboard Area | Sales KPI Dashboards |
- A KPI Dashboard
- Sales Dashboard Examples | Meter Dashboard | Status Dashboard |
- How To Create Project Report | PM Dashboards | Customer ...
- Sales KPI Dashboards
- Sales KPI Dashboards | A KPI Dashboard Provides the Answers ...
- Reporting & Data Visualization | Sales KPI Dashboards | Sales ...

