 Telecommunication Network Diagrams
Telecommunication Network Diagrams solution extends ConceptDraw PRO software with samples, templates, and great collection of vector stencils to help the specialists in a field of networks and telecommunications, as well as other users to create Computer systems networking and Telecommunication network diagrams for various fields, to organize the work of call centers, to design the GPRS networks and GPS navigational systems, mobile, satellite and hybrid communication networks, to construct the mobile TV networks and wireless broadband networks.
HelpDesk
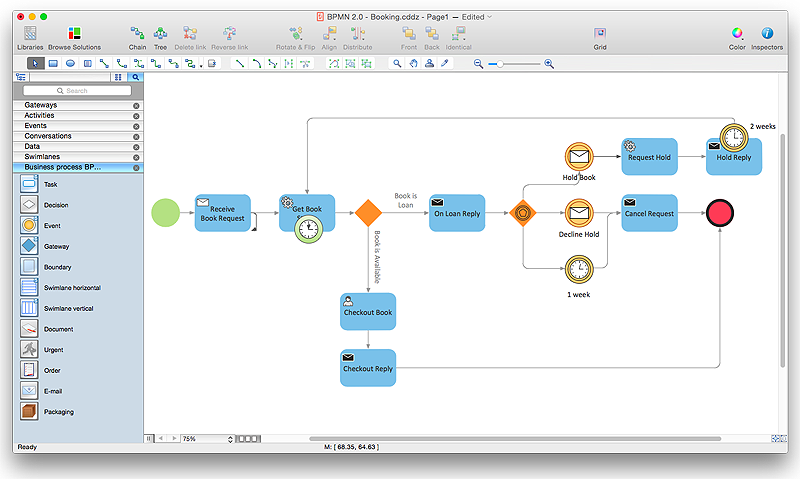
How to Create a BPMN Diagram Using ConceptDraw PRO
Business Process Modeling Notation (BPMN) is a method of illustrating business processes in the form of a diagram. The most effective method of creating or analyzing a business process is to visually interpret the steps using a business process diagram, flowchart or workflow. This is known as business process modeling, and will be performed within a company by a team who have detailed knowledge of company process, and analysts with expertise in the modeling discipline. The objective is often to increase production or lower costs — by modeling the process initially using a flowchart, inefficiencies and problems can be spotted before committing to a decision or strategy. You can create BPMN diagrams using the ConceptDraw PRO diagramming tools. ConceptDraw have designed a solution that combines BPMN v2.0 methodology and graphical notification into one powerful package. The Business Process Diagrams solution from ConceptDraw Solution Park provides a comprehensive collection of vector
 Fishbone Diagram
Fishbone Diagrams solution extends ConceptDraw PRO software with templates, samples and library of vector stencils for drawing the Ishikawa diagrams for cause and effect analysis.
 Fishbone Diagrams
The Fishbone Diagrams solution extends ConceptDraw PRO v10 software with the ability to easily draw the Fishbone Diagrams (Ishikawa Diagrams) to clearly see the cause and effect analysis and also problem solving. The vector graphic diagrams produced using this solution can be used in whitepapers, presentations, datasheets, posters, and published technical material.
 Security and Access Plans
This solution extends ConceptDraw PRO software with physical security plan, security chart, access chart, security plans, access schemes, access plans , CCTV System Plan samples, templates and libraries of design elements for drawing the Security and Acce
 Aerospace and Transport
This solution extends ConceptDraw PRO software with templates, samples and library of vector clipart for drawing the Aerospace and Transport Illustrations. It contains clipart of aerospace objects and transportation vehicles, office buildings and anci
- Computer Assembling Industry Floor Plan
- Technical Drawing Software | Computer and Networks Area ...
- Technical drawing - Machine parts assembling | Process Flowchart ...
- Process Flowchart | Circuits and Logic Diagram Software | Computer ...
- Process Flowchart | Basic Flowchart Symbols and Meaning ...
- Technical drawing - Machine parts assembling | Process Flowchart ...
- Technical drawing - Machine parts assembling | Process Flowchart ...
- Process Flowchart | Basic Flowchart Symbols and Meaning ...
- Design elements - Management diagram | Computer and Networks ...
- Technical drawing - Machine parts assembling | Process Flowchart ...
- Technical drawing - Machine parts assembling | UML Diagram ...
- Mechanical Drawing Symbols | Process Flowchart | Building ...
- Technical drawing - Machine parts assembling | How to Create a ...
- Process Flowchart | Event-driven Process Chain Diagrams EPC ...
- Technical drawing - Machine parts assembling | Process Flowchart ...
- ConceptDraw PRO Network Diagram Tool | Diagramming Software ...
- ConceptDraw Solution Park | Chemical and Process Engineering ...
- Computer and Networks Area | Entity-Relationship Diagram (ERD ...
- Technical drawing - Machine parts assembling | Engineering ...
- Mechanical Drawing Symbols | Engineering | Design elements ...
