Educational Technology Tools
What are the favorite educational technology tools and techniques for teachers? Of course these are pictures, images and education infographics! ConceptDraw PRO software supplied with Education Infographics Solution from the Business Infographics Area provides powerful drawing tools to help design the education infographics of any complexity.How To Convert a Telecommunication Network Diagram to Adobe PDF
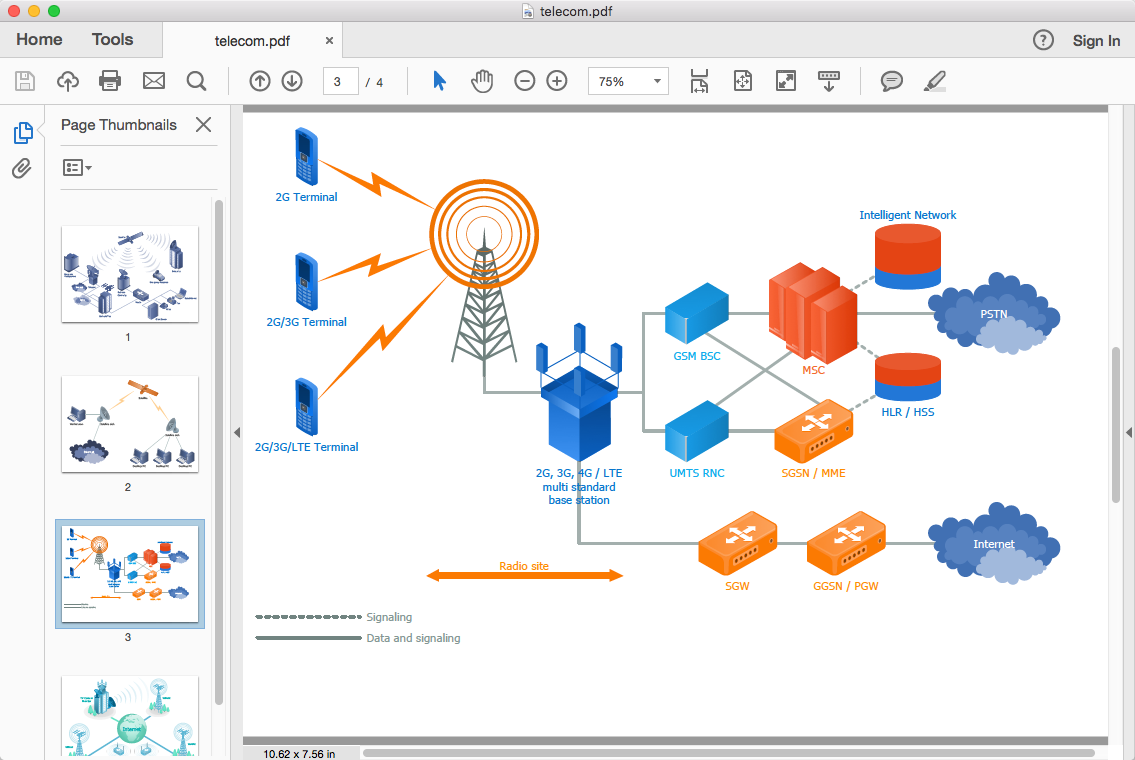
ConceptDraw PRO allows you to easy transmit your telecom network documentation between different computers with different operating systems and applications using it's export capabilities.You can get clear network documentation pack in pdf format and avoid any problems while communicating it with stakeholders.How To Create a Bubble Chart
Bubble diagrams solution extends ConceptDraw PRO software with templates, Using ConceptDraw Connectors, you can create a bubble chart in moments. Using ConceptDraw you will be able to create a bubble chart from the ready ConceptDraw library objects or make your own objects. The created diagram can represent ideas organization, in brainstorming processes, by teachers for explaining difficult ideas or for presentations.Basic Flowchart Symbols and Meaning
Flowcharts are the best for visually representation the business processes and the flow of a custom-order process through various departments within an organization. ConceptDraw PRO diagramming and vector drawing software extended with Flowcharts solution offers the full set of predesigned basic flowchart symbols which are gathered at two libraries: Flowchart and Flowcharts Rapid Draw. Among them are: process, terminator, decision, data, document, display, manual loop, and many other specific symbols. The meaning for each symbol offered by ConceptDraw gives the presentation about their proposed use in professional Flowcharts for business and technical processes, software algorithms, well-developed structures of web sites, Workflow diagrams, Process flow diagram and correlation in developing on-line instructional projects or business process system. Use of ready flow chart symbols in diagrams is incredibly useful - you need simply drag desired from the libraries to your document and arrange them in required order. There are a few serious alternatives to Visio for Mac, one of them is ConceptDraw PRO. It is one of the main contender with the most similar features and capabilities.
 Project Exchange
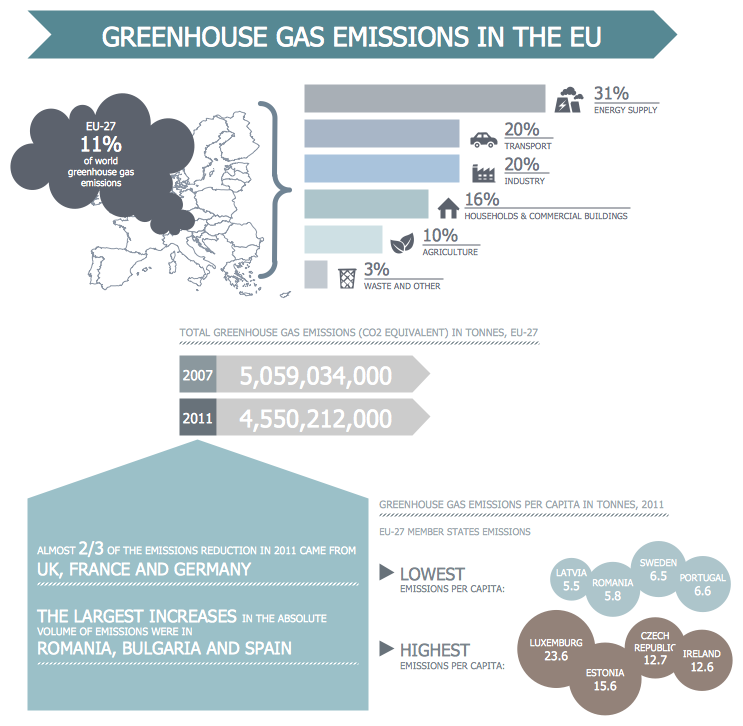
Education Information
The Education Information is multifariuos and can be often represented in various forms. Еру the most successful ways of presentation the information and data are various illustrations, diagrams and colorful education infographics which you can easily make in ConceptDraw PRO software extended with Education Infographics Solution from the Business Infographics Area.How to Create a Business Process Diagram
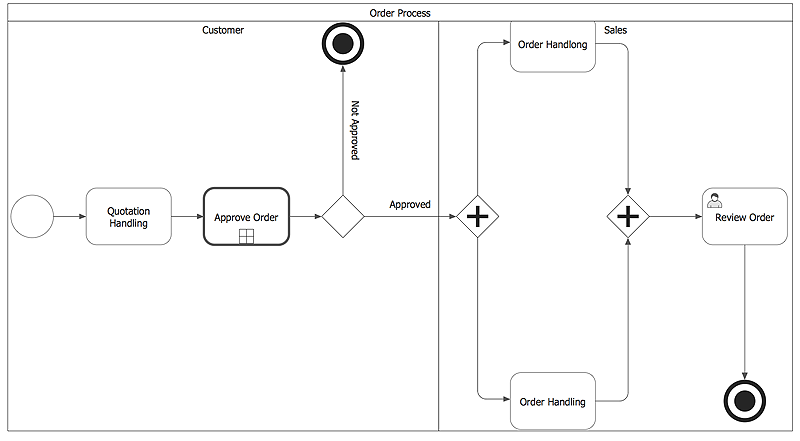
Making a Business Process diagram involves many different elements that can be managed using ConceptDraw PRO. The ability to design Business Process diagrams is delivered by the Business Process Diagrams solution.How To Create a MS Visio Telecommunication Network Diagram
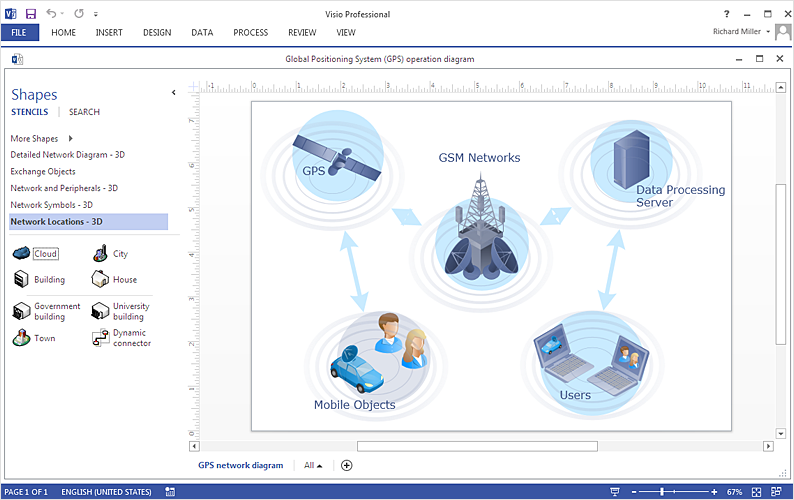
Telecommunication network consists from computers and telecommunication equipment, providing information exchange between network elements. The main purpose of telecommunication networks is to provide access to distributed resources. Making a telecommunication network diagram involves many specific elements of telecommunication technology that can be managed using ConceptDraw PRO. ConceptDraw PRO allows you to easily create telecommunication network diagram of any complexity and then export it to MS Visio VSDX and VDX file. Thus you can create a pack of telecommunication network documentation, that you will easily communicate with other specialists, who use MS Visio.Basic CCTV System Diagram. CCTV Network Diagram Example
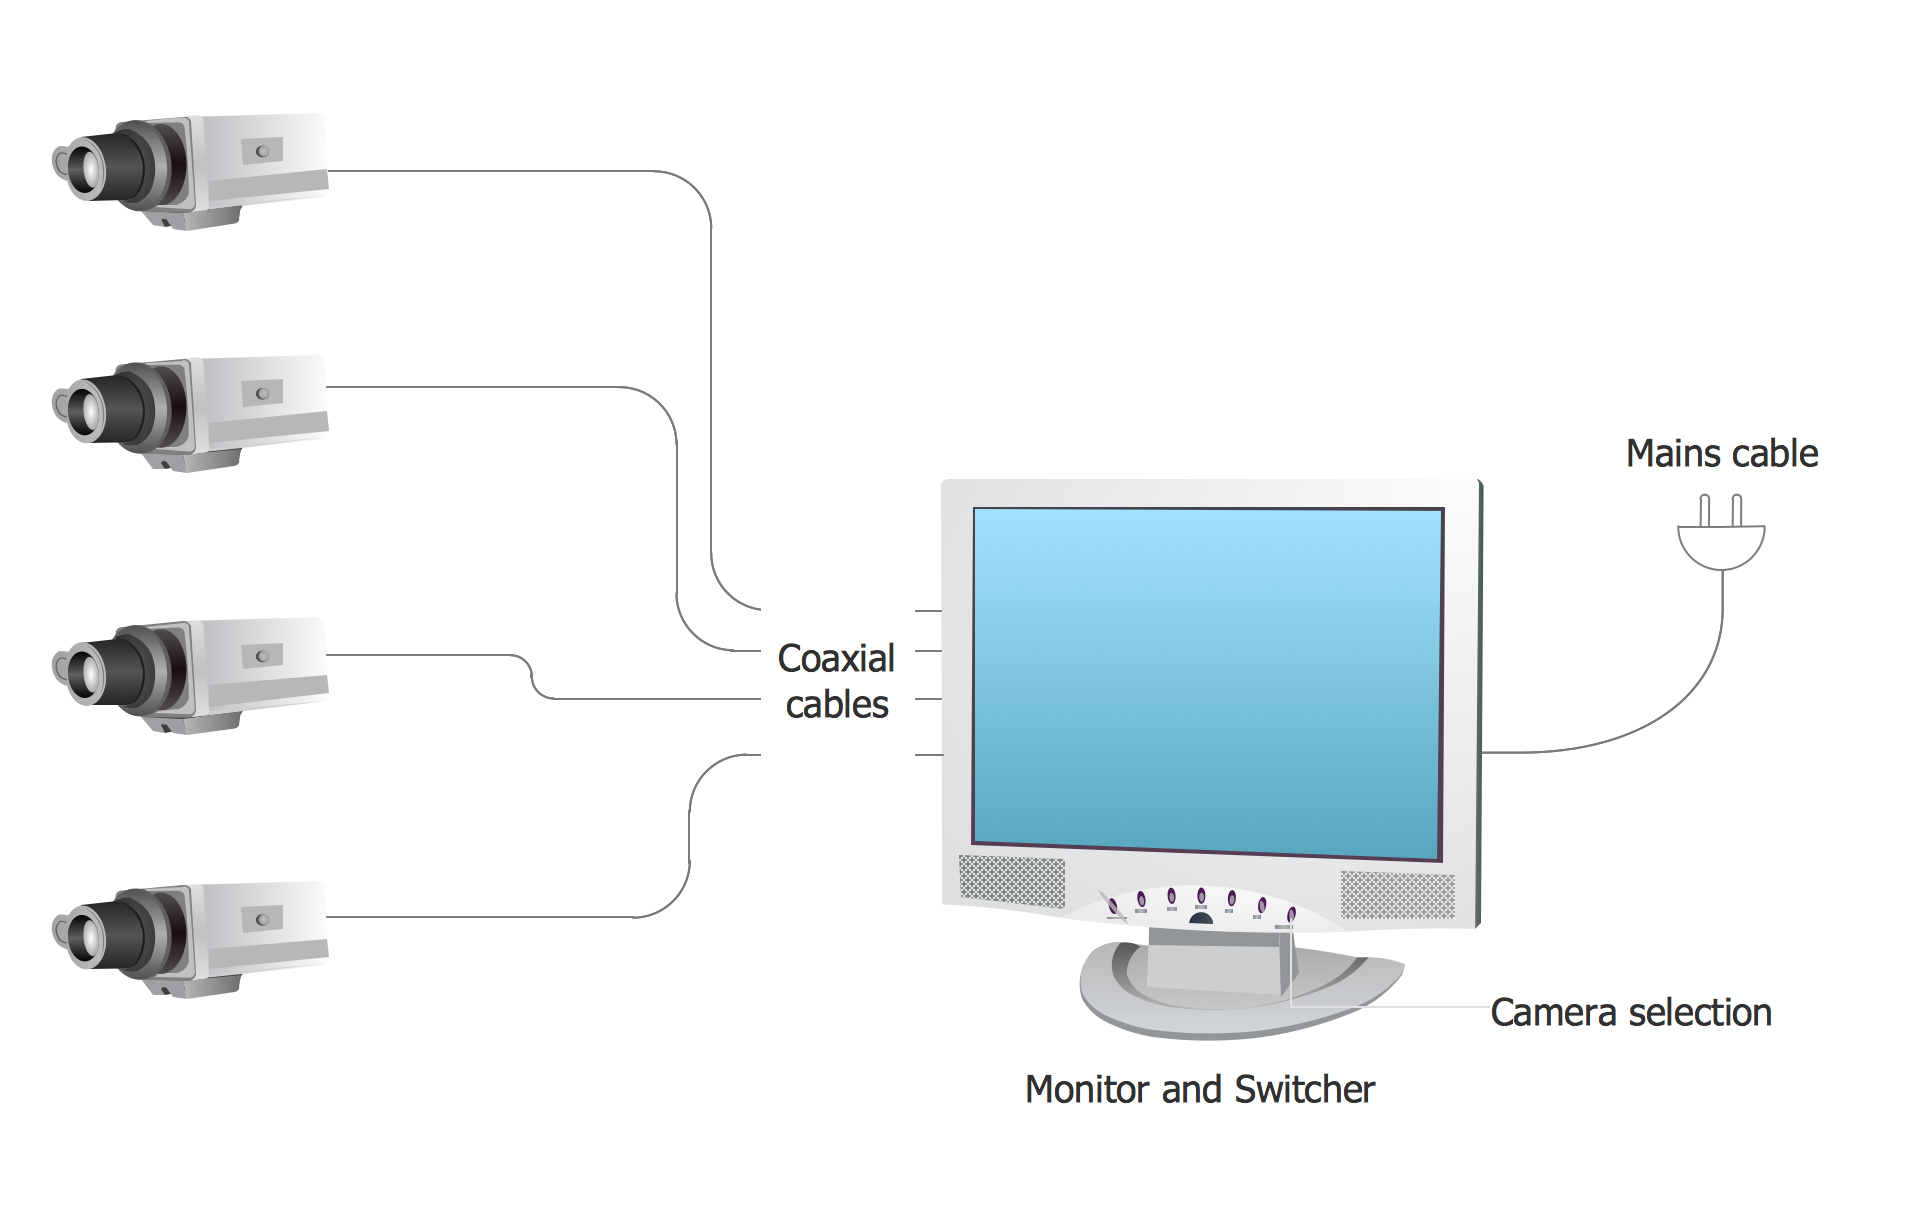
ConceptDraw PRO enhanced with Audio, Video, Media solution is a helpful tool for illustration of a CCTV network. It contains library of vector cliparts of video and TV devices and different digital gadgets for drawing such illustrations
 Computers and Communications
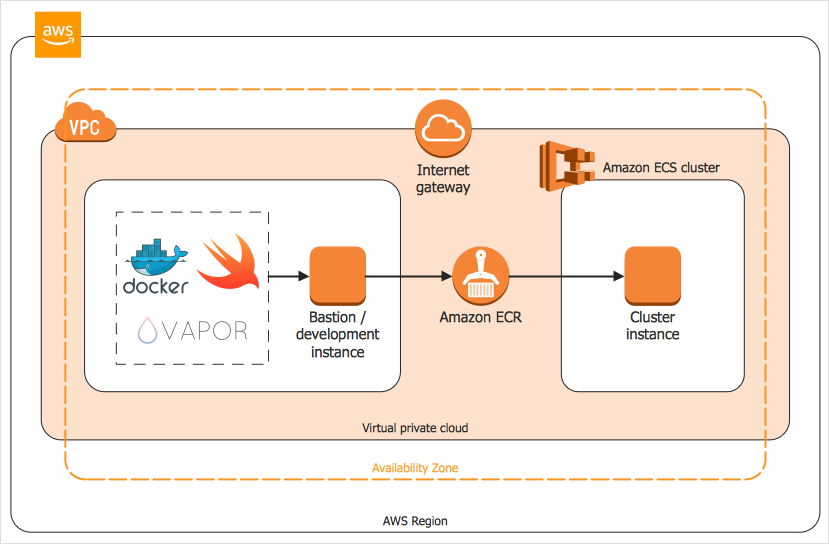
How to Create an AWS Architecture Diagram
Displaying an Amazon Web Service (AWS) cloud actually requires large amounts of attention to detail. Every element of technology has to be addressed: software, middle ware, transaction processing, scaling, data storage; the complete list is staggering. Using the ConceptDraw AWS Architecture Diagrams solution makes much easier the work on documenting the Amazon Web Service architecture. The ConceptDraw AWS Architecture Diagrams solution includes icons, sample and templates for some Amazon Web Services products and resources, to be used when buiding architecture diagrams. The icons are simple so that user can easily incorporate them in his drawings. AWS Architecture Diagrams can be used in presentations, datasheets, or any other technical visualizations.
 Cisco Network Diagrams
How to Create a Time Series Dashboard
Time Series Dashboard means an integration of some type of diagrams: Line Charts, Bar Charts, Column Charts, and Dot Plots on a single space. The ConceptDraw Time Series Dashboard solution can be used to create the interactive Time Series dashboard. The libraries of Time Series Charts solution contain the Live Objects, that can change their appearance depending on the external data. Each chart from the Time Series dashboard displays particular source data. You can include Time Series Charts in your business or technical dashboards to show and compare the items changing over time.Management Consultant
A management consultant is an important person for the company, he helps in the questions of improving business performance and increasing profits, he consults for the questions of business strategy, management and financial controls, resources, and also suggests recommendations for changing the structure of the company if needed.
So, every day management consultant conduct the complex work and often use the helpful management infographics for explain his thoughts and arguments to the company direction. Thanks to the development of computer technologies, drawing of management infographics is so easy today. ConceptDraw PRO diagramming and vector drawing software offers you the Management Infographics Solution from the Business Infographics Area.
 Marketing Diagrams
 HVAC Plans
- Conceptdraw.com: Mind Map Software, Drawing Tools | Project ...
- Program for Making Presentations | Best Mind Mapping Program for ...
- Quality Mind Map | Education Mind Maps | Mind Map Exchange ...
- Diagram Software
- How to show a mind map presentation via Skype | 3 Tips for a Killer ...
- How To Do A Mind Map In PowerPoint | Presenting a Slide Show to ...
- Download Pdf Files In Mechanical Symbols
- How to Add Different Backgrounds Within a Multipage Drawing ...
- Mechanical Engineering Drawing Symbols And Their Meanings Pdf
- How to Send a Mind Map File to Evernote? | How to Add a Mind Map ...
- How To Create Presentation for Trainings and Learning process ...
- Cross-Functional Flowcharts
- Mechanical Drawing Symbols | Technical Drawing Software ...
- Design Element: Active Directory for Network Diagrams | Cisco ...
- ConceptDraw Arrows10 Technology | How To Successfully Hold a ...
- MindTweet | Mind Map Food | How to exchange data files of Mindjet ...
- Cross-Functional Process Map Template | Swim lane process map ...
- Fishbone Analysis Example Pdf
- How To Do A Mind Map In PowerPoint | One formula of professional ...

