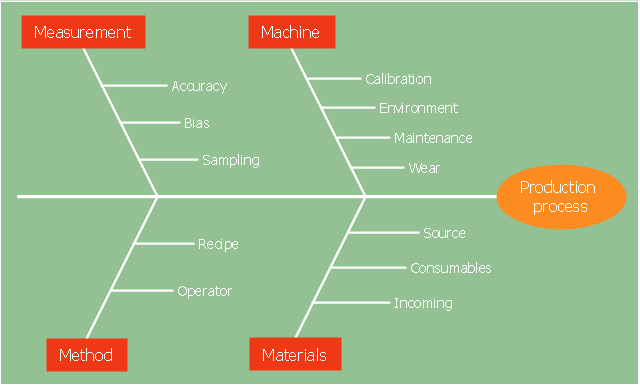
"Causes in the diagram are often categorized, such as to the 6 M's ...
The 6 Ms (used in manufacturing industry)
- Machine (technology)
- Method (process)
- Material (Includes Raw Material, Consumables and Information.)
- Man Power (physical work)/ Mind Power (brain work): Kaizens, Suggestions
- Measurement (Inspection)
- Milieu/ Mother Nature (Environment)
The original 6Ms used by the Toyota Production System have been expanded by some to include the following and are referred to as the 8Ms. However, this is not globally recognized. It has been suggested to return to the roots of the tools and to keep the teaching simple while recognizing the original intent; most programs do not address the 8Ms.
- Management/ Money Power
- Maintenance" [Ishikawa diagram. Wikipedia]
The 4Ms fishbone diagram (cause and effect diagram, Ishikawa diagram) example "Production process" was created using the ConceptDraw PRO diagramming and vector drawing software extended with the Fishbone Diagrams solution from the Management area of ConceptDraw Solution Park.
Total Quality Management Value
The Total quality management (TQM) is an enterprise-wide method of continuous quality improvement of all organizational processes, including the enhancement of ability to deliver high-quality products and services to the customers. The TQM includes eight main elements, which have great value: customer-focused, process-centered, total employee involvement, integrated system, continual improvement, strategic and systematic approach, fact-based decision making, communications. ConceptDraw PRO diagramming and vector drawing software offers the Total Quality Management Diagram solution with effective drawing tools, predesigned vector elements, samples and templates that help easy design the Total Quality Management diagrams, TQM flowcharts and Mind Maps widely used in quality management projects to visualize the business processes and industrial processes for your organization, to demonstrate the quality control step-by-step in a visual manner, to compare visually the ideal and real stages of processes."Causes in the diagram are often categorized, such as to the 6 M's ...
The 6 Ms (used in manufacturing industry):
(1) Machine (technology);
(2) Method (process);
(3) Material (Includes Raw Material, Consumables and Information.);
(4) Man Power (physical work)/ Mind Power (brain work): Kaizens, Suggestions;
(5) Measurement (Inspection);
(6) Milieu/ Mother Nature (Environment).
The original 6Ms used by the Toyota Production System have been expanded by some to include the following and are referred to as the 8Ms. However, this is not globally recognized. It has been suggested to return to the roots of the tools and to keep the teaching simple while recognizing the original intent; most programs do not address the 8Ms.
(7) Management/ Money Power;
(8) Maintenance." [Ishikawa diagram. Wikipedia]
This 8Ms Ishikawa diagram (manufacturing cause and effect diagram) template is included in the Fishbone Diagram solution from the Management area of ConceptDraw Solution Park.
- Total Quality Management Value | Fishbone Diagram | 4ms Of ...
- Total Quality Management Value | Fishbone Diagram | What Is The ...
- Total Quality Management Value | 4 Ms fishbone diagram ...
- Total Quality Management Value | Manufacturing 8 Ms fishbone ...
- 4 Ms fishbone diagram - Production process | Total Quality ...
- Total Quality Management Value | Fishbone Diagram | 4ms Of Total ...
- Total Quality Management Value | Example Of 4ms
- Fishbone Diagram | The 4ms Of Productive Activities
- Fishbone Diagram 4ms
- 4 Ms fishbone diagram - Production process | Manufacturing 8 Ms ...
- Process Flowchart | 4 Ms fishbone diagram - Production process ...
- Total Quality Management Value | Fishbone Diagram | The 4ms Of ...
- Data Flow Diagram Model | Process Flowchart | Manufacturing 8 Ms ...
- 4 Ms fishbone diagram - Production process
- Total Quality Management Value | 4ms Tqm
- 4 Ms fishbone diagram - Production process | Manufacturing 8 Ms ...
- Method Example In Business In 4ms
- 4 Ms fishbone diagram - Production process | Defensive Formation ...
- Manufacturing 8 Ms fishbone diagram - Template | How Do ...


