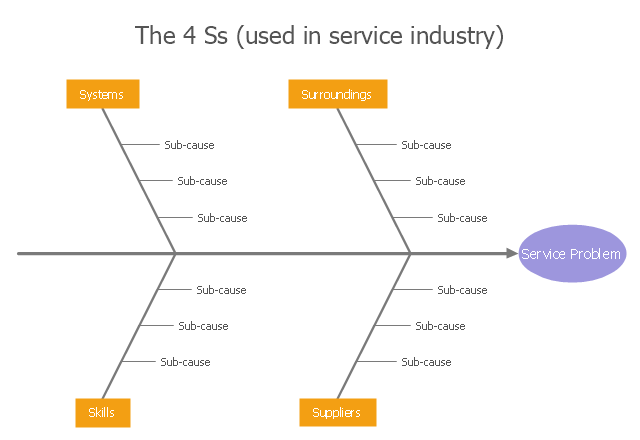
"Causes in the diagram are often categorized, such as to ...
The 5 Ss (used in service industry):
(1) Samples;
(2) Scheme;
(3) Synchronous;
(4) Skin;
(5) Search." [Ishikawa diagram. Wikipedia]
This service 4 Ss Ishikawa diagram (cause and effect diagram) template is included in the Fishbone Diagram solution from the Management area of ConceptDraw Solution Park.
 Fishbone Diagram
Fishbone Diagrams solution extends ConceptDraw PRO software with templates, samples and library of vector stencils for drawing the Ishikawa diagrams for cause and effect analysis.
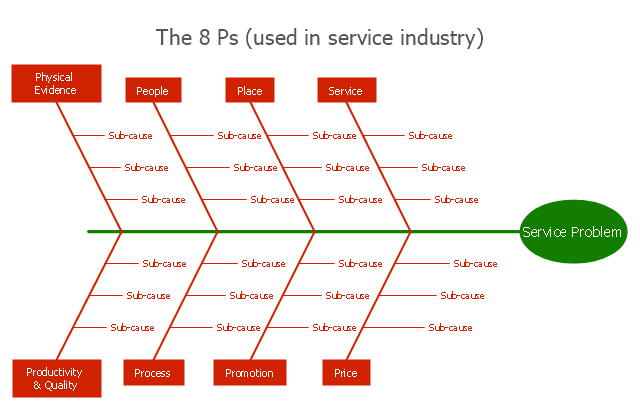
"Causes in the diagram are often categorized, such as to ...
The 7 Ps (used in marketing industry):
(1) Product/ Service;
(2) Price;
(3) Place;
(4) Promotion;
(5) People/ personnel;
(6) Positioning;
(7) Packaging. " [Ishikawa diagram. Wikipedia]
This 8 Ps Ishikawa diagram (service cause and effect diagram) template is included in the Fishbone Diagram solution from the Management area of ConceptDraw Solution Park.
 Fishbone Diagrams
The Fishbone Diagrams solution extends ConceptDraw PRO v10 software with the ability to easily draw the Fishbone Diagrams (Ishikawa Diagrams) to clearly see the cause and effect analysis and also problem solving. The vector graphic diagrams produced using this solution can be used in whitepapers, presentations, datasheets, posters, and published technical material.
HelpDesk
How to Draw a Fishbone Diagram with ConceptDraw PRO
Fishbone (Ishikawa) Diagram is often used in business to determine the cause of some problem. A Fishbone diagram is also called cause-and-effect diagram.The main goal of the Fishbone diagram is to illustrate in a graphical way the relationship between a given outcome and all the factors that influence this outcome. The complete diagram resembles a fish skeleton as its name implies. Cause and Effect analysis is used in management to identify the possible causes of a problem in order to eliminate them. The ability to create a Fishbone Diagram is supported by the Fishbone Diagram solution.
 Management
This solution extends ConceptDraw PRO v9 and ConceptDraw MINDMAP v7 with Management Diagrams and Mind Maps (decision making, scheduling, thinking ideas, problem solving, business planning, company organizing, SWOT analysis, preparing and holding meetings
 Visio Exchange
Our Visio Exchange tool allows you to Import and export native MS Visio 2013 files that are in the new MS Visio drawing (VSDX) format introduced in the most recent Visio iteration. In addition, ConceptDraw PRO v10 supports the import and export of MS Visio 2007-2010 XML. (VDX) files more accurately then previous versions of ConceptDraw PRO. If you have the older MS Visio 2007-2010.
- Fishbone Diagram Example For Service Industry
- Service 8 Ps fishbone diagram - Template | Fishbone Diagram ...
- Service 4 Ss fishbone diagram - Template | Fishbone Diagram ...
- Service 4 Ss fishbone diagram - Template | Process Flowchart ...
- Fishbone Diagram | Workflow Diagram Examples | Service 4 Ss ...
- Fishbone Diagram | Service 4 Ss fishbone diagram - Template ...
- Service 4 Ss fishbone diagram - Template | Service 8 Ps fishbone ...
- Service 8 Ps fishbone diagram - Template | Management | Service ...
- Service 8 Ps fishbone diagram - Template | How Do Fishbone ...
- Block diagram - Gap model of service quality | Taxi Service Data ...
- Draw Fishbone Diagram on MAC Software | Manufacturing 8 Ms ...
- The Fish Bone Diagram In Service Marketing
- Fishbone Diagram Service Industry Example
- Service 8 Ps fishbone diagram - Template | Management | Quality ...
- Service Industry Marketing Problem Fishbone Diagram
- Fishbone Diagram | Fishbone Diagram Template | Service 8 Ps ...
- Service 8 Ps fishbone diagram - Template | Accounting Flowcharts ...
- Block diagram - Gap model of service quality | Fishbone Diagram ...
- Fishbone Diagram | How Do Fishbone Diagrams Solve ...


