 Fishbone Diagram
Fishbone Diagrams solution extends ConceptDraw PRO software with templates, samples and library of vector stencils for drawing the Ishikawa diagrams for cause and effect analysis.
 Fishbone Diagrams
The Fishbone Diagrams solution extends ConceptDraw PRO v10 software with the ability to easily draw the Fishbone Diagrams (Ishikawa Diagrams) to clearly see the cause and effect analysis and also problem solving. The vector graphic diagrams produced using this solution can be used in whitepapers, presentations, datasheets, posters, and published technical material.
HelpDesk
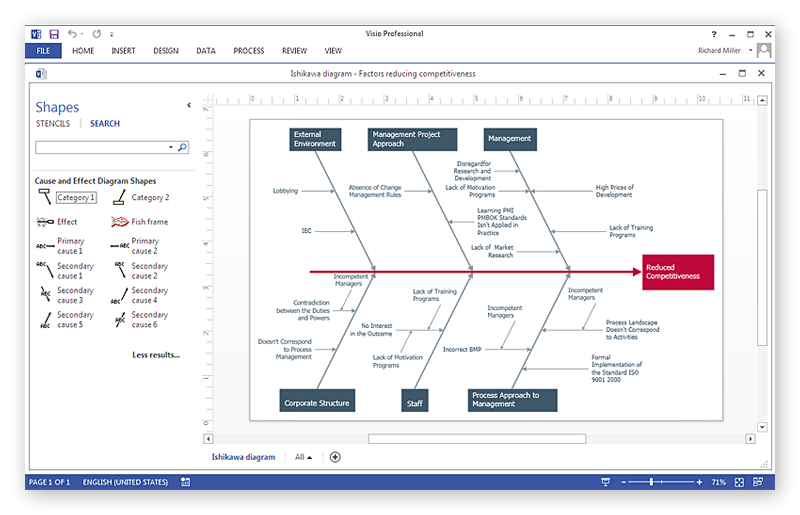
How To Create a MS Visio Cause and Effect Diagram Using ConceptDraw PRO
Cause-and-Effect Ishikawa Diagram is a graphical method of analysis and cause-effect relationships, a tool in the form of fish bone. It is used to systematically determine the cause of the problem and represent it graphically. The technique is primarily used in the framework of quality management for the analysis of quality problems and their causes. Nowadays, it has found worldwide distribution and is used in multiple problem areas. It is one of the tools of lean manufacturing, which is used in group work to find the problems and their causes. ConceptDraw PRO allows you to easily create Fishbone (Ishikawa) diagram and then make a MS Visio VSDX, or VSD files from your diagrams in a couple clicks, using the export capabilities of ConcewptDraw PRO.HelpDesk
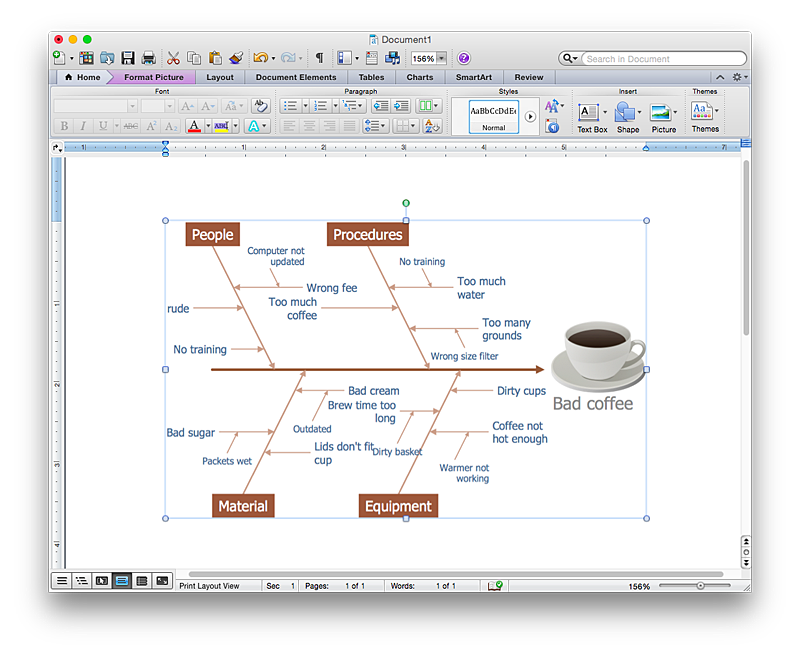
How to Add a Fishbone (Ishikawa) Diagram to a MS Word Document Using ConceptDraw PRO
The ability to create a fishbone (Ishikawa) Diagram is supported by the ConceptDraw Fishbone Diagram solution. ConceptDraw PRO allows you to easily create a fishbone diagrams and then insert them into a MS Word document.- Using Fishbone Diagrams for Problem Solving | Cause and Effect ...
- PROBLEM ANALYSIS . Root Cause Analysis Tree Diagram | How To ...
- PROBLEM ANALYSIS Prioritization Matrix | PROBLEM ANALYSIS ...
- PROBLEM ANALYSIS . Root Cause Analysis Tree Diagram | Cause ...
- Cause and Effect Analysis ( Fishbone Diagrams) | Problem solving ...
- Business Productivity Diagramming | Manufacturing 8 Ms fishbone ...
- Using Fishbone Diagrams for Problem Solving | Cause and Effect ...
- Cause and Effect Analysis ( Fishbone Diagrams) | Cause and Effect ...
- Problem solving | Cause and Effect Analysis ( Fishbone Diagrams ...
- Cause and Effect Analysis ( Fishbone Diagrams) | Cause & Effect ...
- Cause and Effect Analysis ( Fishbone Diagrams) | Business ...
- Cause and Effect Analysis ( Fishbone Diagrams) | Using Fishbone ...
- Fishbone Diagram | Business Productivity Diagramming | Cause ...
- Cause and Effect Analysis ( Fishbone Diagrams) | Business ...
- Cause and Effect Analysis ( Fishbone Diagrams) | How To Create ...
- Fishbone Analysis Example Pdf
- Cause and Effect Analysis ( Fishbone Diagrams) | Using Fishbone ...
- Cause & Effect Analysis | Fishbone Diagram Software for Design ...
- PROBLEM ANALYSIS Relations Diagram | PROBLEM ANALYSIS ...
- Fishbone Diagram | Cause and Effect Analysis ( Fishbone Diagrams ...

