This site uses cookies. By continuing to browse the ConceptDraw site you are agreeing to our Use of Site Cookies.

Fishbone Diagram Template

A causal model is an abstract concept, that describes the causal mechanisms of a system, by noting certain variables and their influence on each other, in an effort to discover the cause of a certain problem or flaw. This model is presented in diagram form by using a fishbone diagram.
ConceptDraw DIAGRAM diagramming and vector drawing software enhanced with Fishbone Diagrams solution helps you create business productivity diagrams from Fishbone diagram templates and examples, that provide to start using of the graphic method for the analysis of problem causes. Each predesigned Fishbone Diagram template is ready to use and useful for instantly drawing your own Fishbone Diagram.
HelpDesk

How To Create Cause and Effect (Fishbone) Diagram in MS Visio

Cause-and-Effect Ishikawa Diagram is a graphical method of analysis and cause-effect relationships, a tool in the form of fish bone. It is used to systematically determine the cause of the problem and represent it graphically. The technique is primarily used in the framework of quality management for the analysis of quality problems and their causes. Nowadays, it has found worldwide distribution and is used in multiple problem areas. It is one of the tools of lean manufacturing, which is used in group work to find the problems and their causes. ConceptDraw DIAGRAM allows you to easily create Fishbone (Ishikawa) diagram and then make an MS Visio VSDX, or VSD files from your diagrams in a couple clicks, using the export capabilities of ConceptDraw DIAGRAM.

fishbone diagram, Ishikawa diagram, cause and effect analysis Fishbone Diagrams

fishbone diagram, Ishikawa diagram, cause and effect analysis
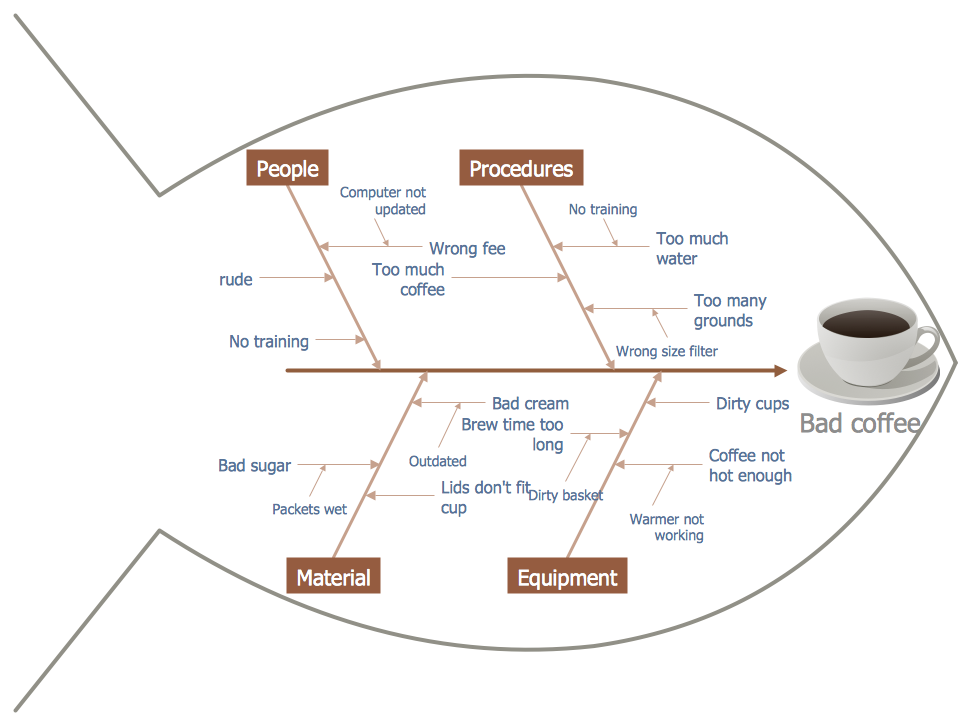
The Fishbone Diagrams solution extends ConceptDraw DIAGRAM software with the ability to easily draw the Fishbone Diagrams (Ishikawa Diagrams) to clearly see the cause and effect analysis and also problem solving. The vector graphic diagrams produced using this solution can be used in whitepapers, presentations, datasheets, posters, and published technical material.

?Management Diagrams, Matrixes, Organizational Charts, decision making, scheduling, thinking ideas, problem solving, business planning, company organizing, SWOT analysis Management

?Management Diagrams, Matrixes, Organizational Charts, decision making, scheduling, thinking ideas, problem solving, business planning, company organizing, SWOT analysis
This solution extends ConceptDraw DIAGRAM and ConceptDraw MINDMAP with Management Diagrams and Mind Maps (decision making, scheduling, thinking ideas, problem solving, business planning, company organizing, SWOT analysis, preparing and holding meetings

Ishikawa Diagram

In almost every sphere of life and work the people time to time are faced with the fact that on their way there are certain obstacles and problems. But it is not always possible to identify the true cause of particular problem. To understand the basic causes of problems and eliminate them, it is convenient to use the chart of Kaoru Ishikawa - the technique specially designed for this.
ConceptDraw DIAGRAM diagramming and vector drawing software extended with Fishbone Diagrams solution from the Management area can help you with construction the Fishbone Diagram also known as Ishikawa Diagram.
Ishikawa Diagram shows factors of Equipment, Process, People, Materials, Environment and Management, all affecting the overall problem in one drawing for the further analysis. It is a well effective way to analyze the business problems you must identify and solve.

Cause and Effect Diagram

ConceptDraw DIAGRAM software extended with Fishbone Diagrams solution from the Management area of ConceptDraw Solution Park is perfect for Cause and Effect Diagram creating. It gives the ability to draw fishbone diagram that identifies many possible causes for an effect or a problem. Causes and Effects are usually grouped into major categories to identify these sources of variation. Causes and Effects in the diagram show relationships among various factor. Fishbone diagram shows factors of Equipment, Process, People, Materials, Environment and Management, all affecting the overall problem.

Cause and Effect Fishbone Diagram

Cause and Effect Fishbone Diagram is one of the popular productivity and management tools widely used in business organizations. It is also known as Fishbone Diagram, because it looks like a fish skeleton. Cause and Effect Diagram provides a structured way which helps to identify all possible causes of a problem. Cause and Effect Diagram can be applied anywhere where exists a causal relationship.
Now the problem of complexity the Cause and Effect Fishbone Diagram creating is solved thanks to the ConceptDraw DIAGRAM diagramming and vector drawing software extended with Fishbone Diagrams solution from the Management area.

Cause and Effect Diagrams

Cause and Effect Diagrams are designed to identify the potential factors that cause an overall effect. The causes are grouped into the categories, each cause is a source of variation.
ConceptDraw DIAGRAM powerful diagramming and vector drawing software provides the Fishbone Diagrams solution from the Management area of ConceptDraw Solution Park that allows to design the Cause and Effect Diagrams quick, easy and effective.

Fishbone Diagram

Fishbone Diagram is another name for the Cause and Effect Diagram or the Ishikawa Diagram which got its name from the fact that it looks like a fish skeleton. Developed by Kaoru Ishikawa in 1968, a Fishbone Diagram is effectively used for a cause and effect analysis which allows to consider all possible causes for a certain problem or event.
ConceptDraw DIAGRAM supplied with Fishbone Diagrams solution from the Management area is the best software for fast and easy drawing professional looking Fishbone Diagram.

Fishbone Problem Solving

The knowledge and ability to apply various strategies for dealing with problems and difficult situations is very useful in many areas. The Fishbone strategy is one of the most progressive. This graphical technique helps to identify possible causes of problems, to set the goals, and also show internal connections between the different parts of problem. After reviewing all causes and facts, you can easily find right solution.
ConceptDraw DIAGRAM diagramming and vector drawing software extended with Fishbone Diagrams Solution from the Management Area of ConceptDraw Solution Park is a powerful Fishbone Problem Solving tool.

cross-functional flowchart, workflow, process chart, IDEF0, timeline, calendar, Gantt chart, business process modeling, audit flowchart, opportunity flowchart Business Processes

cross-functional flowchart, workflow, process chart, IDEF0, timeline, calendar, Gantt chart, business process modeling, audit flowchart, opportunity flowchart
Business Process solution extends ConceptDraw DIAGRAM software with business process diagrams as cross-functional flowcharts, workflows, process charts, IDEF0, timelines, calendars, Gantt charts, business process modeling, audit and opportunity flowcharts.

ConceptDraw Solution Park ConceptDraw Solution Park

ConceptDraw Solution Park
ConceptDraw Solution Park collects graphic extensions, examples and learning materials

Business diagrams & Org Charts with ConceptDraw DIAGRAM

Business flowcharting tool helps you create a flowchart with minimal effort. With ConceptDraw you can make a flowchart, draw data flow diagrams, orgchart professional, process flow diagrams etc - without any prior knowledge or training.
Draw Business Process Diagrams

How to Make a Timeline

Timeline is a type of diagram which illustrates the series of events in a chronological order on a linear timescale. How to make a timeline? It is convenient to use a modern powerful software. ConceptDraw DIAGRAM diagramming and vector drawing software extended with Timeline Diagrams solution from the Management area is exactly what you need.