HelpDesk
How to Connect Text Data to a Time Series Chart on Your Live Dashboard
Time Series Dashboard means an integration of some type of diagrams: Line Charts, Bar Charts, Column Charts, and Dot Plots on a single space. The ConceptDraw Time Series Dashboard solution can be used to create the interactive Time Series dashboard. The libraries of Time Series Charts solution contain the Live Objects, that can change their appearance depending on the external data. Each chart from the Time Series dashboard displays particular source data. You can include Time Series Charts in your business or technical dashboards to show and compare the items changing over time.
HelpDesk
How to Create a Hook Up Diagram
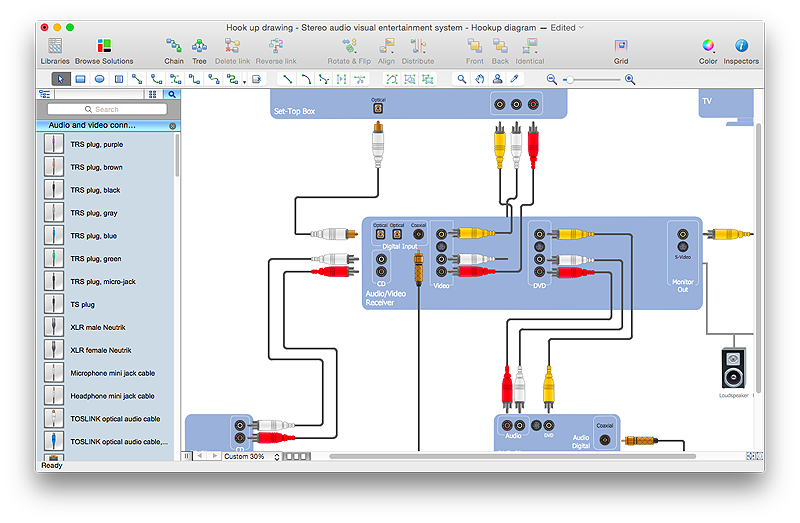
Hook-up diagram of audio-video system is a detailed drawing showing the audio video connections in a correct manner so that system operates properly. Using the hook up diagram you can understand how the elements of your audio-video system should be installed. ConceptDraw PRO allows you to draw the Hook Up diagram of Audio-Video system easily using the set of special libraries provided by Audio and Video Connectors solution.HelpDesk
How to Add a Wireless Network Diagram to a PowerPoint Presentation Using ConceptDraw PRO
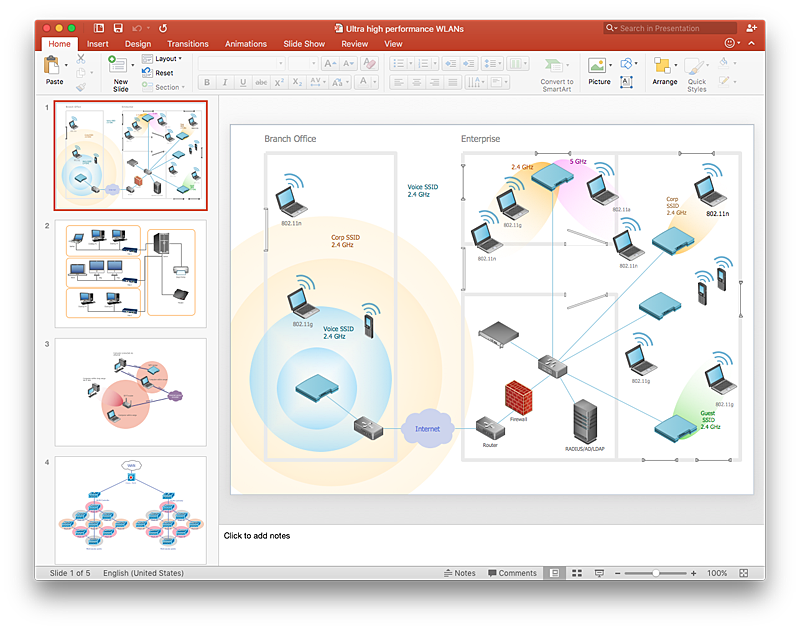
The PowerPoint presentation of wireless network can be very informative. ConceptDraw PRO allows you to easily create wireless network diagrams and then make a PowerPoint Presentation from your diagrams in a single click.
 ConceptDraw Solution Park
ConceptDraw Solution Park collects graphic extensions, examples and learning materials
HelpDesk
How to Add a Telecommunication Network Diagram to a PowerPoint Presentation Using ConceptDraw PRO
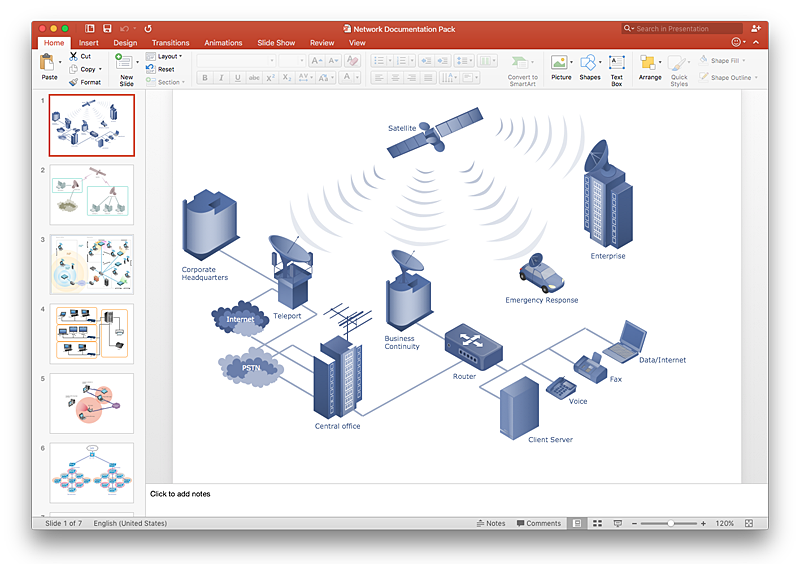
Telecommunication network diagram represents a system consisting of computers, servers, telecommunication devices, switches, satellites, wireless transmitters, antennas, cables, etc., that link a set of remote nodes. It is also describes a telephone exchange, that connects calls between landlines. ConceptDraw PRO allows you to easily create telecommunication network diagrams and then make a PowerPoint Presentation from your network documentation in a few clicks. Telecommunication network diagrams are used to show components and connections in a telecommunications network: how they are interacted between each other and with end-users. The PowerPoint presentation on concept of telecom network can be very informative and helpful. ConceptDraw PRO allows you to make a MS PowerPoint Presentation from your telecommunication network diagrams in a few clicks.
 Audio and Video Connectors
The Audio and Video Connectors solution contains a set of video connectors, audio connectors and s video connection; you will also find pre-designed objects, libraries, templates, and samples, allowing quick and easy diagramming of various configurations
 ConceptDraw Solution Park
ConceptDraw Solution Park collects graphic extensions, examples and learning materials
HelpDesk
How to Create Project Diagrams on PC
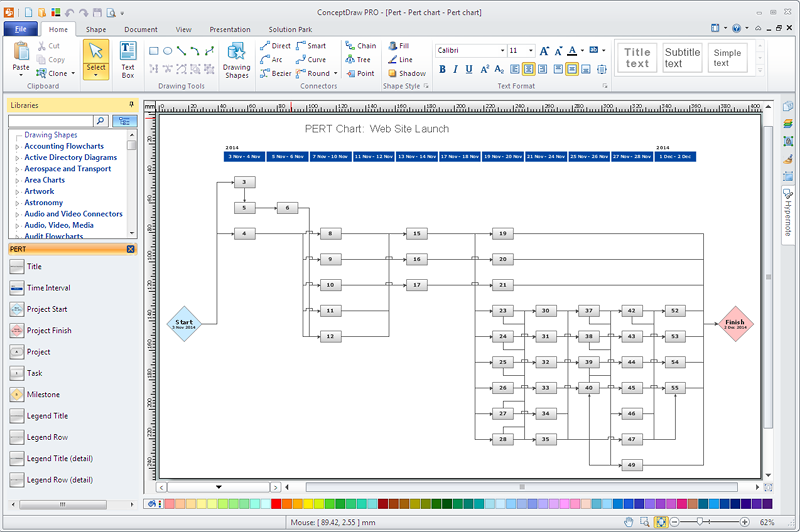
Visual diagrams gives the ability to view at a detailed level project attributes such as project scope, logical connections in the project, critical paths, key events on the timeline, milestones, tasks, calendars for work, and resource utilization.
 Computer Network Diagrams
Computer Network Diagrams solution extends ConceptDraw PRO software with samples, templates and libraries of vector stencils for drawing the computer network topology diagrams.
 Network Layout Floor Plans
Network Layout Floor Plan solution extends ConceptDraw PR software with samples, templates and libraries of vector stencils for drawing the computer network layout floor plans.
HelpDesk
How to Manage Problem Solving Using Seven Management and Planning Tools
Stage by stage gouide on using visual tools to move toward solving the problem.
 Computers and Communications
Computers and communications solution extends ConceptDraw PRO software with illustration samples, templates and vector stencils libraries with clip art of computers, control devices, communications, technology, Apple machines.
- How to Connect Text Data to a Time Series Chart on Your Live ...
- SWOT Analysis | SWOT and TOWS Matrix Diagrams | How to Make ...
- How to Use ConceptDraw Sales Dashboard Solution | Process ...
- UML Use Case Diagram Example Social Networking Sites Project ...
- PM Dashboards | KPI Dashboard | How to Identify Project ...
- How to Create an Entity-Relationship Diagram Using ConceptDraw ...
- Data Flow Diagrams
- Sales Dashboard | Visualize Sales Data Using Sample Data
- Free Draw On Video Software
- How to Export Project Data to MS Excel Worksheet | How to ...
- Wireless Networks | How to Create a Wireless Network Diagram ...
- Telecommunication Network Diagrams | How to Create a ...
- How To Create Project Report | How to Create Project Diagrams on ...
- How to Create a Hook Up Diagram
- Blank Scatter Plot | Donut Chart Templates | How to Draw a Pictorial ...
- Helpdesk How To
- How to Create a PowerPoint® Presentation from a Mind Map | How ...
- How to Edit a Project Task List | Program Evaluation and Review ...
- Column Chart Examples | Column Chart Software | How to Create a ...


