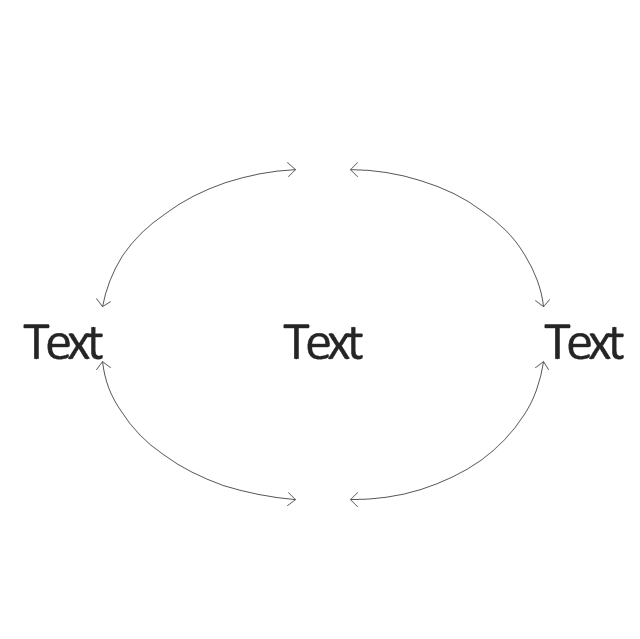
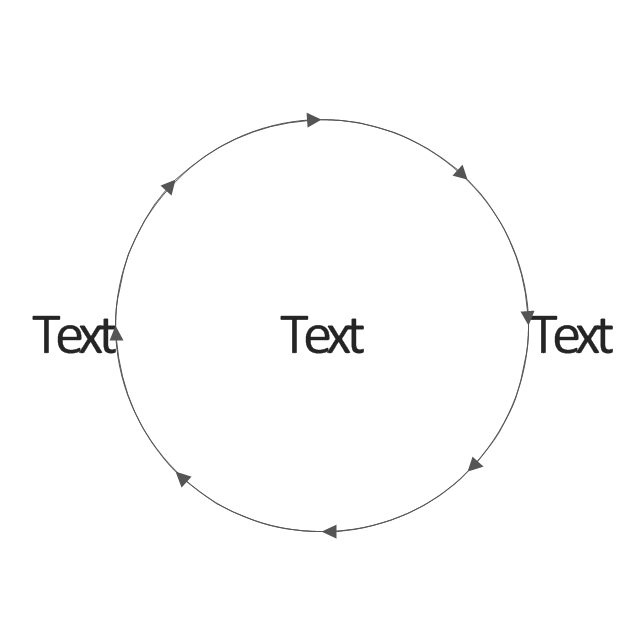
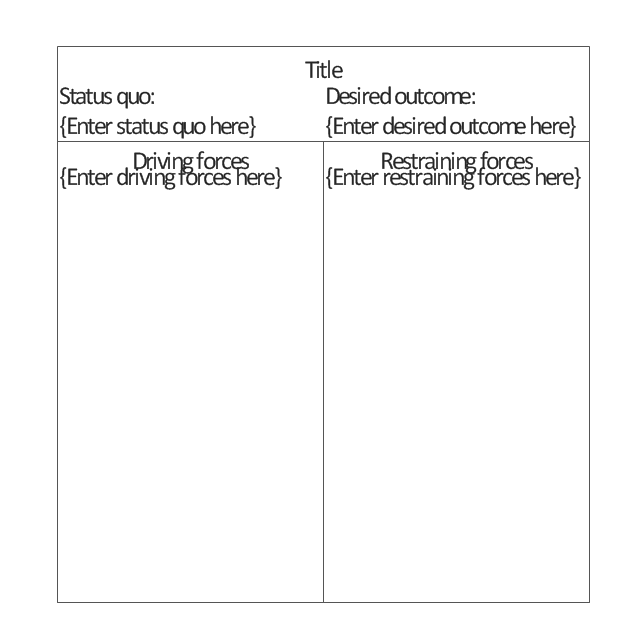
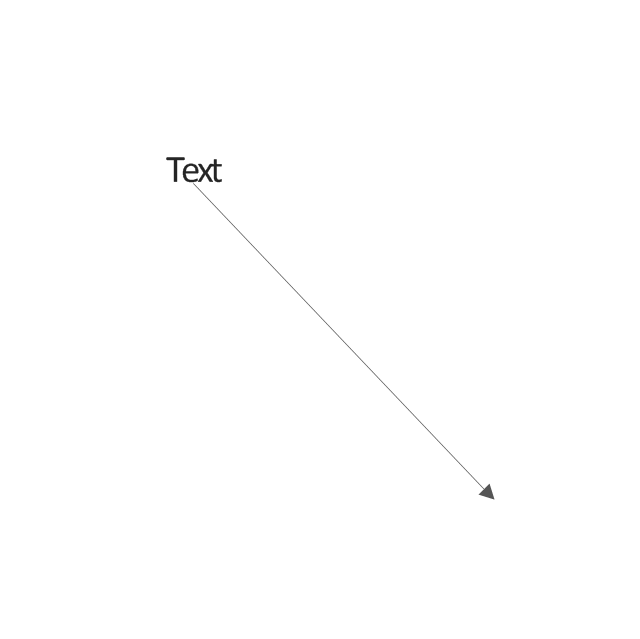
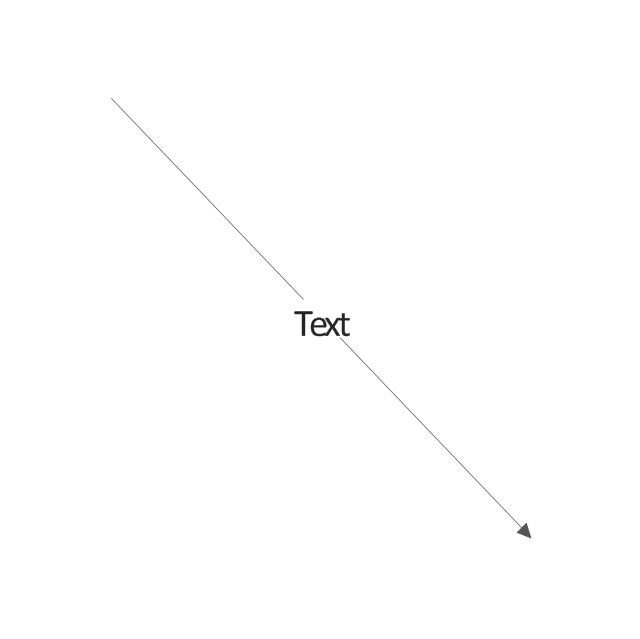
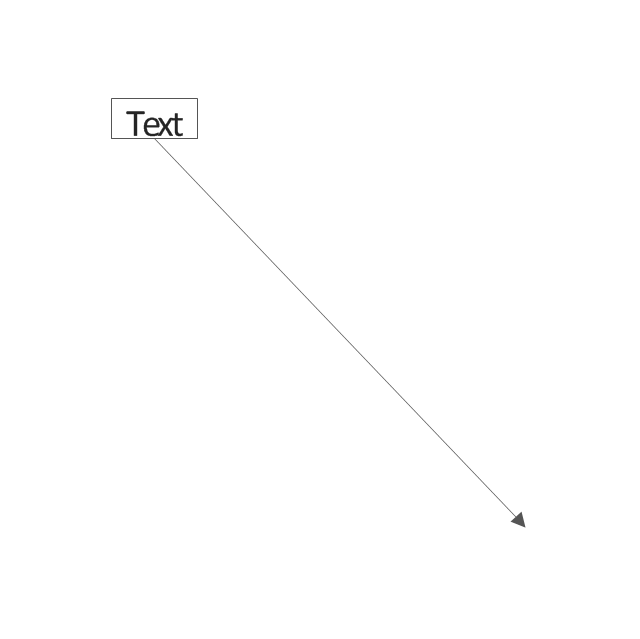
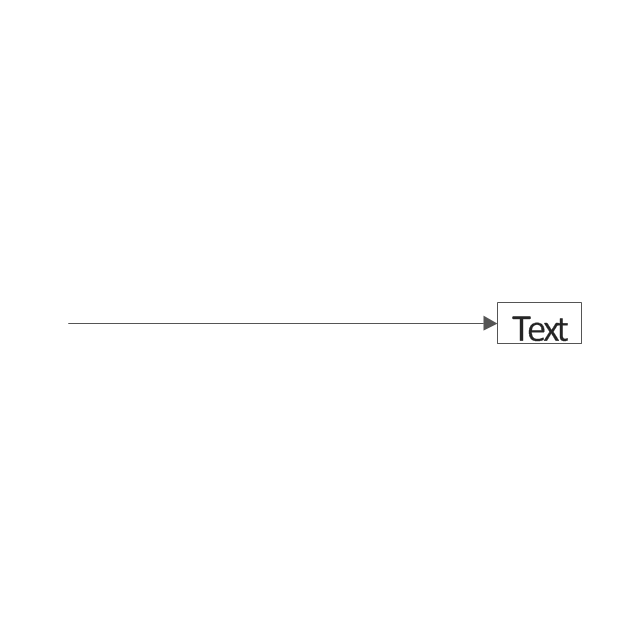
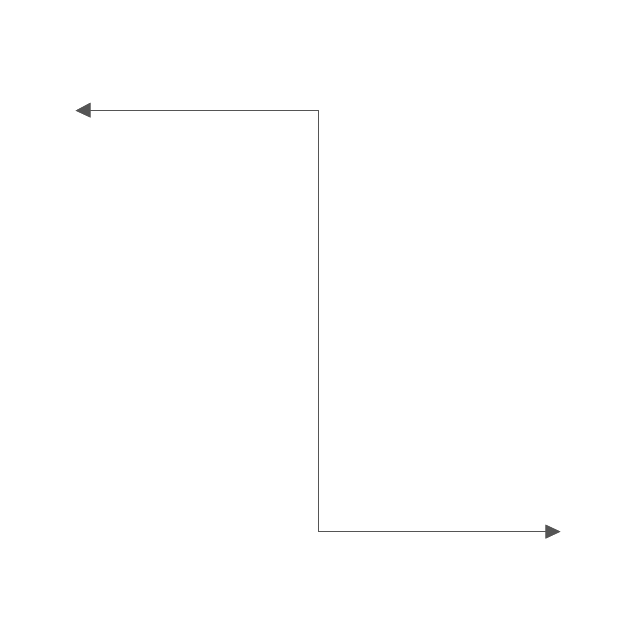
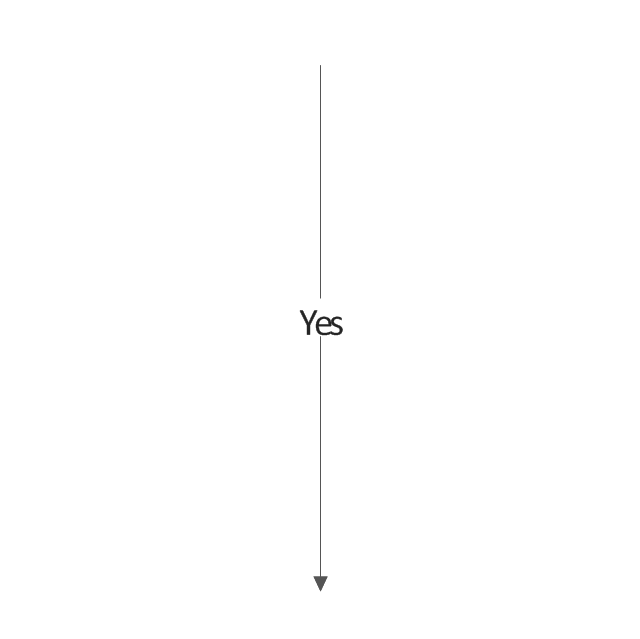
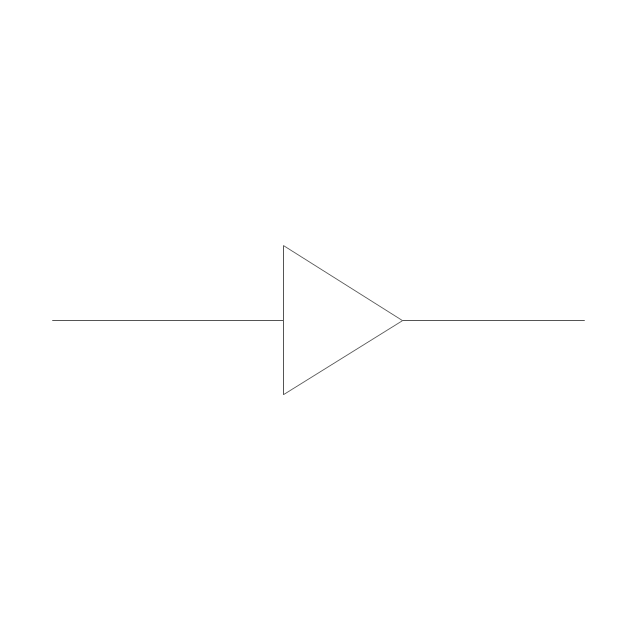
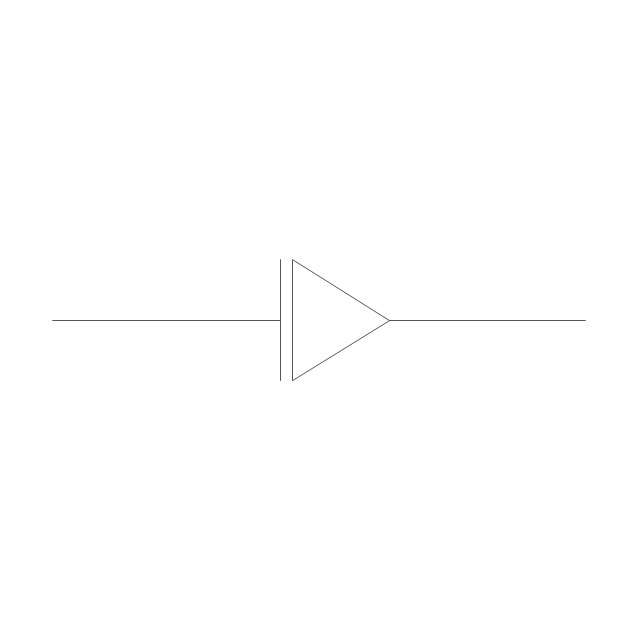
The vector stencils library "TQM diagrams" contains 58 TQM symbols. Use it in business process re-engineering, total quality management, continuous improvement, and quality solutions to draw cause-and-effect diagrams, top-down, and cross-functional process flow charts in the ConceptDraw PRO diagramming and vector drawing software extended with the Total Quality Management (TQM) Diagrams solution from the Quality area of ConceptDraw Solution Park.
The vector stencils library "TQM diagrams" contains 58 TQM symbols. Use it in business process re-engineering, total quality management, continuous improvement, and quality solutions to draw cause-and-effect diagrams, top-down, and cross-functional process flow charts in the ConceptDraw PRO diagramming and vector drawing software extended with the Total Quality Management (TQM) Diagrams solution from the Quality area of ConceptDraw Solution Park.
The vector stencils library "TQM diagrams" contains 58 TQM symbols. Use it in business process re-engineering, total quality management, continuous improvement, and quality solutions to draw cause-and-effect diagrams, top-down, and cross-functional process flow charts in the ConceptDraw PRO diagramming and vector drawing software extended with the Total Quality Management (TQM) Diagrams solution from the Quality area of ConceptDraw Solution Park.
The vector stencils library "TQM diagrams" contains 58 TQM symbols. Use it in business process re-engineering, total quality management, continuous improvement, and quality solutions to draw cause-and-effect diagrams, top-down, and cross-functional process flow charts in the ConceptDraw PRO diagramming and vector drawing software extended with the Total Quality Management (TQM) Diagrams solution from the Quality area of ConceptDraw Solution Park.
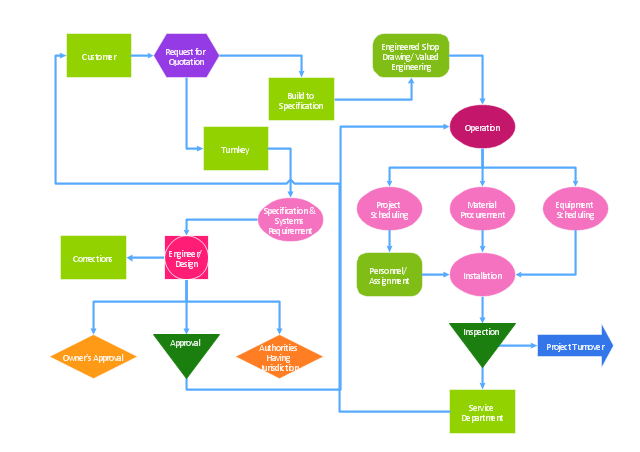
"The Process Flow Chart provides a visual representation of the steps in a process. ...
When to Use:
One of the first activities of a process improvement effort is constructing a flowchart. It provides the following benefits:
1- It give you and everyone a clear understanding of the process.
2- Facilitates teamwork and communication.
3- Helps to identify non-value-added operations."
[bexcellence.org/ Flow-Chart.html]
This TQM diagram example shows a business process that can be then analyzed to improve the effectiveness and diagnose quality issues that require resolution.
This example was created using the ConceptDraw PRO diagramming and vector drawing software extended with the Total Quality Management (TQM) Diagrams solution from the Quality area of ConceptDraw Solution Park.
"Causes in the diagram are often categorized, such as to the 6 M's ...
The 6 Ms (used in manufacturing industry):
(1) Machine (technology);
(2) Method (process);
(3) Material (Includes Raw Material, Consumables and Information.);
(4) Man Power (physical work)/ Mind Power (brain work): Kaizens, Suggestions;
(5) Measurement (Inspection);
(6) Milieu/ Mother Nature (Environment).
The original 6Ms used by the Toyota Production System have been expanded by some to include the following and are referred to as the 8Ms. However, this is not globally recognized. It has been suggested to return to the roots of the tools and to keep the teaching simple while recognizing the original intent; most programs do not address the 8Ms.
(7) Management/ Money Power;
(8) Maintenance." [Ishikawa diagram. Wikipedia]
This 8Ms Ishikawa diagram (manufacturing cause and effect diagram) template is included in the Fishbone Diagram solution from the Management area of ConceptDraw Solution Park.
- UML timing diagram - Inspection | UML Diagram | UML Diagram ...
- UML object diagram - Safety inspection | Diagramming Software for ...
- UML timing diagram - Inspection | UML object diagram - Safety ...
- UML object diagram - Safety inspection | Diagramming Software for ...
- ATM UML Diagrams | UML Diagrams with ConceptDraw PRO | UML ...
- Safety and Security | UML object diagram - Safety inspection | Fire ...
- TQM diagram template | TQM diagram example | Rapid UML ...
- Flow Chart Symbols | Er Diagram Of Inspection Tool
- Diagramming Software for Design UML Timing Diagrams | Timing ...
- Software development with ConceptDraw Products | UML Diagrams ...
- TQM diagrams - Vector stencils library
- TQM diagrams - Vector stencils library
- TQM diagrams - Vector stencils library
- Timing diagram | UML Timing Diagram , Design Elements ...
- TQM diagrams - Vector stencils library
- Fire Safety Inspection
- Cause Effect Diagrams Tqm
- Resources and TEAF Work Products for EA Direction, Description ...
- TQM diagrams - Vector stencils library | TQM diagram - Template ...








-tqm-diagrams---vector-stencils-library.png--diagram-flowchart-example.png)
-tqm-diagrams---vector-stencils-library.png--diagram-flowchart-example.png)
-tqm-diagrams---vector-stencils-library.png--diagram-flowchart-example.png)
-tqm-diagrams---vector-stencils-library.png--diagram-flowchart-example.png)








-tqm-diagrams---vector-stencils-library.png--diagram-flowchart-example.png)


-tqm-diagrams---vector-stencils-library.png--diagram-flowchart-example.png)
-tqm-diagrams---vector-stencils-library.png--diagram-flowchart-example.png)
-tqm-diagrams---vector-stencils-library.png--diagram-flowchart-example.png)
-tqm-diagrams---vector-stencils-library.png--diagram-flowchart-example.png)
-tqm-diagrams---vector-stencils-library.png--diagram-flowchart-example.png)
-tqm-diagrams---vector-stencils-library.png--diagram-flowchart-example.png)
-tqm-diagrams---vector-stencils-library.png--diagram-flowchart-example.png)
-tqm-diagrams---vector-stencils-library.png--diagram-flowchart-example.png)
-tqm-diagrams---vector-stencils-library.png--diagram-flowchart-example.png)
-tqm-diagrams---vector-stencils-library.png--diagram-flowchart-example.png)
-tqm-diagrams---vector-stencils-library.png--diagram-flowchart-example.png)
-tqm-diagrams---vector-stencils-library.png--diagram-flowchart-example.png)
-tqm-diagrams---vector-stencils-library.png--diagram-flowchart-example.png)
