 Logistic Dashboard
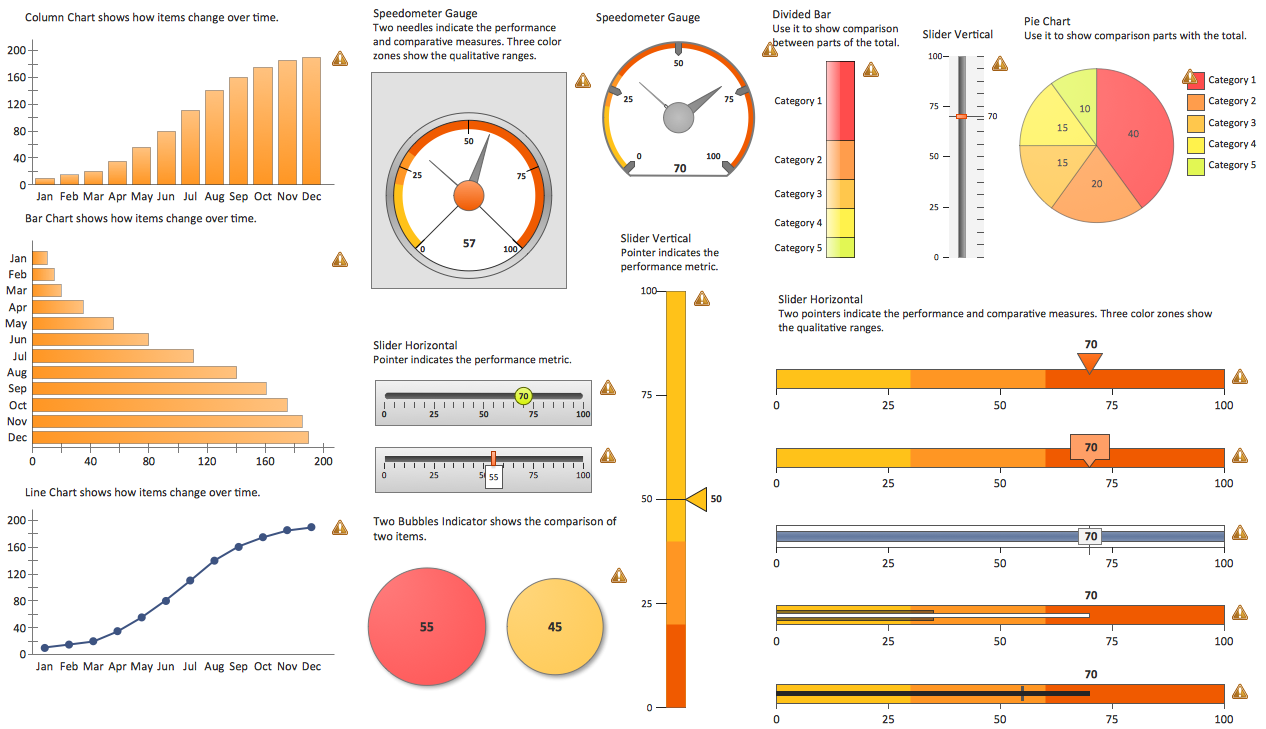
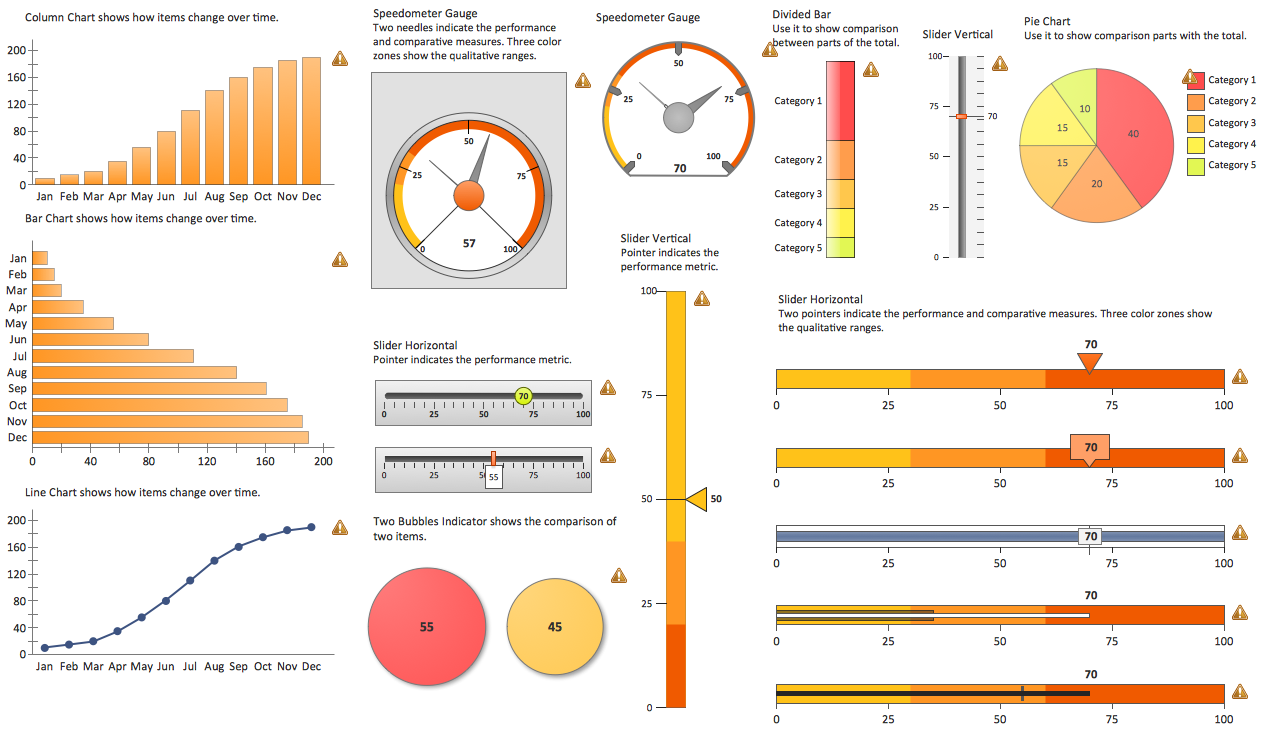
The powerful tools of Logistic Dashboard solution and specially developed live graphic objects of logistic icons, logistic navigation elements, logistic indicators, logistic charts and logistic maps effectively assist in designing Logistic dashboards, Logistic maps, Logistic charts, diagrams and infographics. The included set of prebuilt samples and quick-start templates, demonstrates the power of ConceptDraw DIAGRAM software in logistics management, its assisting abilities in development, realization and analyzing the logistic processes, as well as in perfection the methods of logistics management.
Performance Indicators
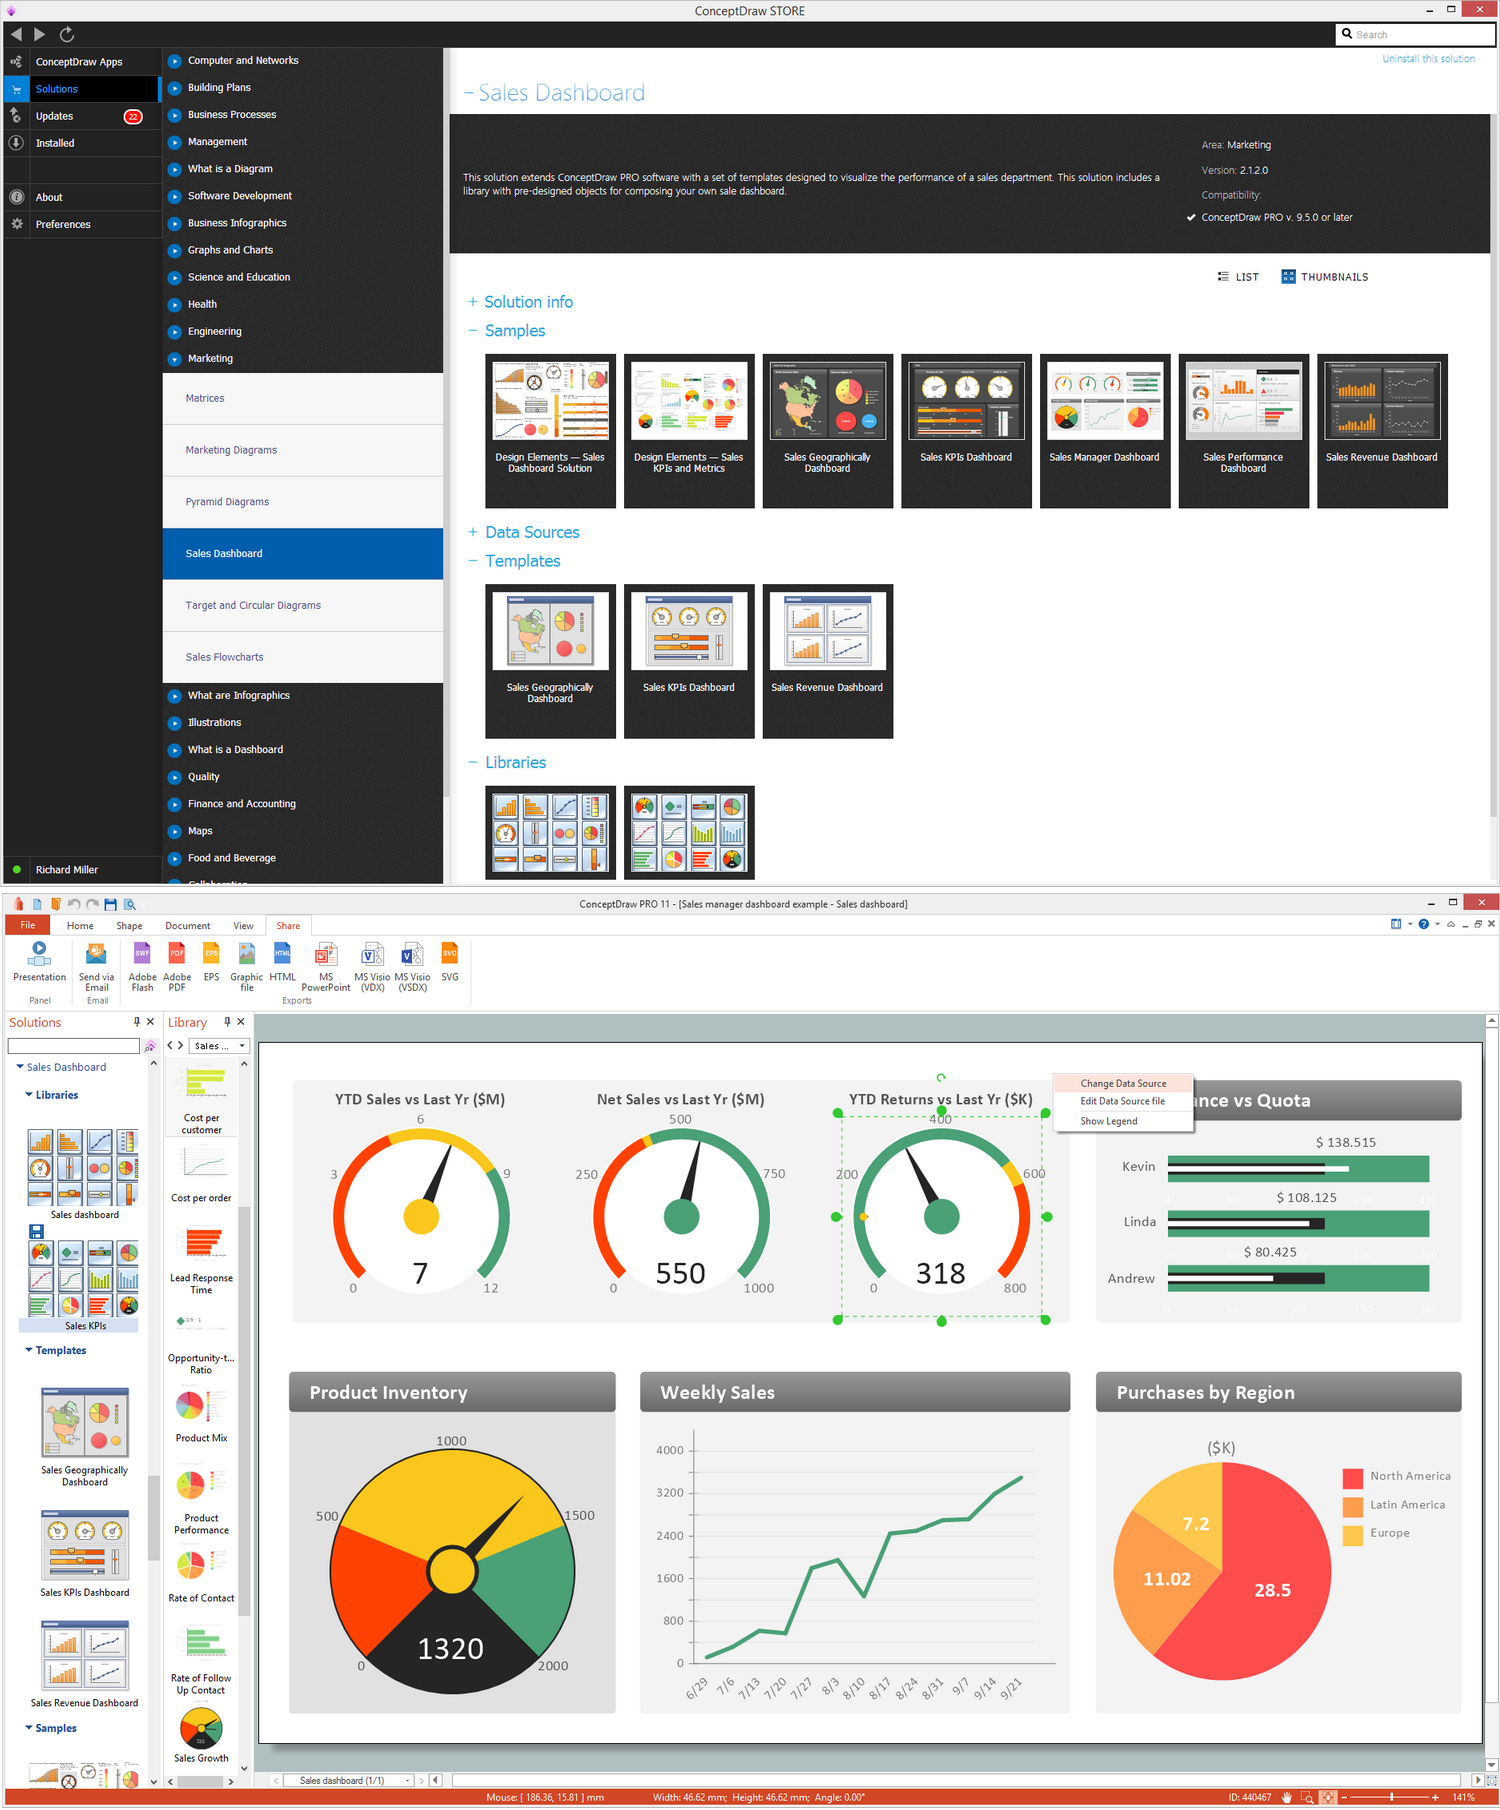
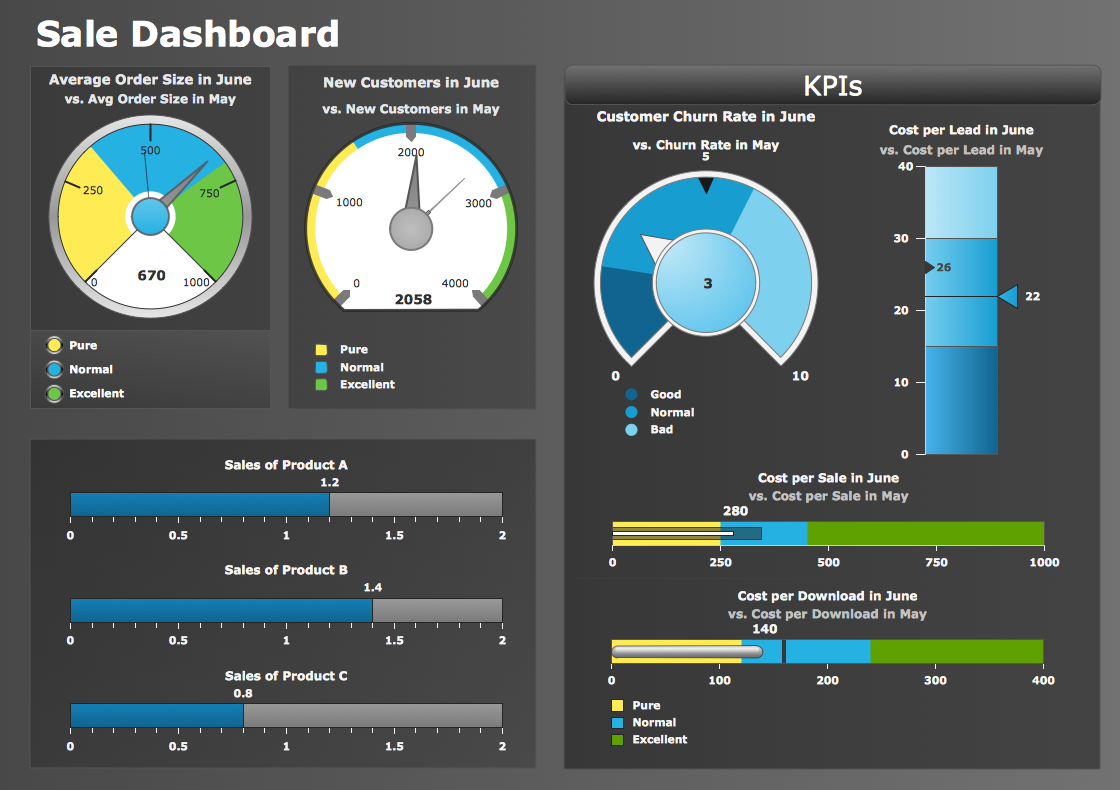
ConceptDraw DIAGRAM diagramming and vector drawing software offers the useful tools of the Sales Dashboard solution from the Marketing area for easy creating professional looking live dashboards which allow to track the business sales activity and progress thanks to representing the Key Performance Indicators (KPIs) on them.
 HR Dashboard
The HR Dashboard solution extends ConceptDraw DIAGRAM functionality with powerful drawing tools and great collection of comprehensive vector design elements, icons, pictograms and objects, navigation elements, live objects of HR charts, HR indicators, and thematic maps. The range of HR Dashboards applications is extensive, among them the human resource management, recruitment, hiring process, human resource development. ConceptDraw DIAGRAM software is perfect for creation HR Dashboard with any goal you need. It gives you all opportunities for designing not only informative, but also professional looking and attractive HR Dashboards of any style and degree of detalization, that are perfect for using in presentations, reports and other thematic documents.
 Sales Dashboard
Sales Dashboard solution extends ConceptDraw DIAGRAM software with templates, samples and library of vector stencils for drawing the visual dashboards of sale metrics and key performance indicators (KPI).
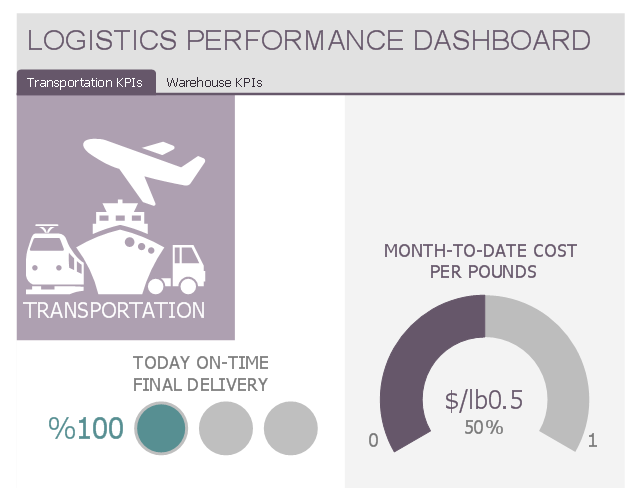
This multipage performance dashboard template contains navigation tab set and graphic indicators of logistic key performance indicators (KPIs) and business metrics.
Use it to create your logistic performance dashboard with ConceptDraw PRO software.
The business dashboard template "Logistics Performance Dashboard" is included in Logistic Dashboard solution from Business Processes area of ConceptDraw Solution Park.
Use it to create your logistic performance dashboard with ConceptDraw PRO software.
The business dashboard template "Logistics Performance Dashboard" is included in Logistic Dashboard solution from Business Processes area of ConceptDraw Solution Park.
 Meter Dashboard
Meter dashboard solution extends ConceptDraw DIAGRAM software with templates, samples and vector stencils library with meter indicators for drawing visual dashboards showing quantitative data.
 Status Dashboard
Status dashboard solution extends ConceptDraw DIAGRAM software with templates, samples and vector stencils libraries with graphic indicators for drawing the visual dashboards showing status data.
Dashboard
ConceptDraw DIAGRAM extended with Sales Dashboard solution from the Marketing area of ConceptDraw Solution Park is a perfect software for creating the live dashboard for the business data and progress visualization.Sales Performance
Measuring sales performance is key task to see how your business can improve. Visualizing sales data with ConceptDraw Sales Dashboard you get a clear picture of sales performance.Sales Dashboard - insight about potential opportunities and key sales operations
ConceptDraw Sales Dashboard gives you a clear insight about potential opportunities and key sales operations. Analysing sales KPI is a proven way to see how your business can improve.
 ConceptDraw Dashboard for Facebook
ConceptDraw Dashboard for Facebook solution extends ConceptDraw DIAGRAM software with a dynamically updated visual dashboard, which shows lifetime total likes, daily friends of fans, and daily page views, information you can receive from Facebook Insights.
Sales Dashboards for Your Company
ConceptDraw DIAGRAM software extended with the Sales Dashboard solution allows you produce sales dashboards for your company easily. You can start from samples and templates delivered with the solution and then modify them to get a dashboard that suites your specific needs.Customer Relationship Management
Customer relationship management is an important component of sales success. Visualizing sales data you may put some KPI related to customers relationship management to your Sales dashboard and track this important aspect in real time."As a discipline, task management embraces several key activities. Various conceptual breakdowns exist, and these, at a high-level, always include creative, functional, project, performance and service activities.
Creative activities pertain to task creation. In context, these should allow for task planning, brainstorming, creation, elaboration, clarification, organization, reduction, targeting and preliminary prioritization.
Functional activities pertain to personnel, sales, quality or other management areas, for the ultimate purpose of ensuring production of final goods and services for delivery to customers. In context these should allow for planning, reporting, tracking, prioritizing, configuring, delegating, and managing of tasks.
Project activities pertain to planning and time and costs reporting. These can encompass multiple functional activities but are always greater and more purposeful than the sum of its parts. In context project activities should allow for project task breakdown, task allocation, inventory across projects, and concurrent access to task databases.
Service activities pertain to client and internal company services provision, including customer relationship management and knowledge management. In context these should allow for file attachment and links to tasks, document management, access rights management, inventory of client & employee records, orders & calls management, and annotating tasks.
Performance activities pertain to tracking performance and fulfillment of assigned tasks. In context these should allow for tracking by time, cost control, stakeholders and priority; charts, exportable reports, status updates, deadline adjustments, and activity logging.
Report activities pertain to the presentation of information regarding the other five activities listed, including graphical display." [Task management. Wikipedia]
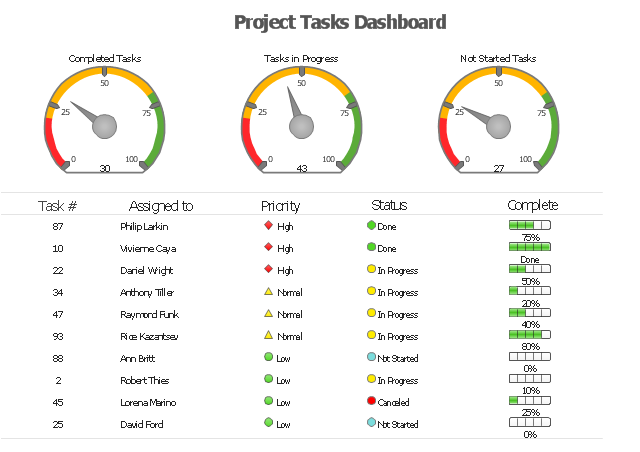
The example "Project tasks dashboard" was created using the ConceptDraw PRO diagramming and vector drawing software extended with the Status Dashboard solution from the area "What is a Dashboard" of ConceptDraw Solution Park.
Data Visualization Solutions
Data visualization solutions help you to see how your business can improve. Visualizing sales data using ConceptDraw Sales Dashboard gives you a bird's-eye view of the sale process.Visualize Sales Data Using Sample Data
ConceptDraw DIAGRAM software extended with the Sales Dashboard solution allows you visualize sales data using sample data delivered with the solution to choose visual indicators you need, and then connect these indicators to your real data.Computer Hardware - Reseller Business Plan
When developing a business plan it is very important to accurately represent the structure and visually outline all important information. A business plan usually has a clear hierarchical structure. The Mind Maps are particularly effective to describe such structures, they are one of the most powerful and visually intuitive tools for the tasks of structuring and memorizing large amounts of information. The Mind Maps are indispensable in development the complex projects, in preparation and discussion of business plans, in designing the presentations, in process of decision making, holding brainstorming, time management, etc. As for the software for working with Mind Maps, particularly effective is a cross-platform ConceptDraw MINDMAP software for Windows and Mac OS X. It provides many tools that help in business plan preparation for organizing the new business, in developing a business plan for promotion some product, etc. ConceptDraw MINDMAP supports the multipage documents, the export and import into popular applications MS PowerPoint, MS Word, PDF, MindManager, in project management applications ConceptDraw Project and MS Project, and in various graphical formats. You can to observe a Mind Map of a business plan for computer hardware reseller designed in ConceptDraw MINDMAP.Reporting & Data Visualization
Using professional reporting and data visualization is the way your business can improve. ConceptDraw Sales Dashboard solution allows you produce live dashboards show KPI to monitor you sales activity and results in real time.- Performance Indicators | Logistic Dashboard | HR Dashboard | Key ...
- Performance Indicators | Dashboard | Logistic Dashboard | Key ...
- Sales Kpi Dashboard Excel
- Employee Performance Dashboard Template In Excel
- Kpi Dashboard Excel Template Free Download
- KPI Dashboard | What is a KPI ? | Performance Indicators | Key ...
- Free Kpi Template Excel
- Logistics Performance Dashboard - Template | Sales KPIs ...
- Safety Dashboard Excel Templates Free
- Logistic Dashboard | Logistics KPI Dashboard - Template | Logistics ...
- Simple Kpi Dashboard Template Excel
- How to Use ConceptDraw Sales Dashboard Solution | Logistic ...
- Sales Performance | Performance Indicators | Sales Dashboard ...
- Dynamic Dashboard Template In Excel
- Performance On Image By Using Ms Excel Data
- Enterprise dashboard | KPI Dashboard | HR Flowcharts | Human ...
- Kpi Correlation Template
- Project Monitoring Excel
- Sales KPI Dashboards | A KPI Dashboard Provides the Answers ...

