Total Quality Management Value
The Total quality management (TQM) is an enterprise-wide method of continuous quality improvement of all organizational processes, including the enhancement of ability to deliver high-quality products and services to the customers. The TQM includes eight main elements, which have great value: customer-focused, process-centered, total employee involvement, integrated system, continual improvement, strategic and systematic approach, fact-based decision making, communications. ConceptDraw DIAGRAM diagramming and vector drawing software offers the Total Quality Management Diagram solution with effective drawing tools, predesigned vector elements, samples and templates that help easy design the Total Quality Management diagrams, TQM flowcharts and Mind Maps widely used in quality management projects to visualize the business processes and industrial processes for your organization, to demonstrate the quality control step-by-step in a visual manner, to compare visually the ideal and real stages of processes.TQM Diagram Tool
The Total Quality Management Diagram solution helps you and your organization visualize business and industrial processes. Create Total Quality Management diagrams for business process with ConceptDraw software.Total Quality Management Business Diagram
The Total Quality Management Diagram solution helps you and your organization visualize business and industrial processes. Create Total Quality Management diagrams for business process with ConceptDraw software.Total Quality Management with ConceptDraw
Total Quality Management (TQM) system is the management method where the confidence in quality of all organization processes is placed foremost. The given method is widely used in production, in educational system, in government organizations and so on.TQM Diagram Example
The Total Quality Management Diagram solution helps you and your organization visualize business and industrial processes. Create Total Quality Management diagrams for business process with ConceptDraw software.TQM Software — Build Professional TQM Diagrams
The Total Quality Management Diagram solution helps you and your organization visualize business and industrial processes. Create Total Quality Management diagrams for business process with ConceptDraw software.
 Fishbone Diagrams
The Fishbone Diagrams solution extends ConceptDraw DIAGRAM software with the ability to easily draw the Fishbone Diagrams (Ishikawa Diagrams) to clearly see the cause and effect analysis and also problem solving. The vector graphic diagrams produced using this solution can be used in whitepapers, presentations, datasheets, posters, and published technical material.
 ConceptDraw Solution Park
ConceptDraw Solution Park collects graphic extensions, examples and learning materials
 Picture Graphs
Typically, a Picture Graph has very broad usage. They many times used successfully in marketing, management, and manufacturing. The Picture Graphs Solution extends the capabilities of ConceptDraw DIAGRAM with templates, samples, and a library of professionally developed vector stencils for designing Picture Graphs.
 Total Quality Management TQM Diagrams
Total Quality Management Diagrams solution extends ConceptDraw DIAGRAM software with samples, templates and vector stencils library for drawing the TQM flowcharts.
 Fault Tree Analysis Diagrams
This solution extends ConceptDraw DIAGRAM.5 or later with templates, fault tree analysis example, samples and a library of vector design elements for drawing FTA diagrams (or negative analytical trees), cause and effect diagrams and fault tree diagrams.
HelpDesk
How to Draw a Fishbone Diagram
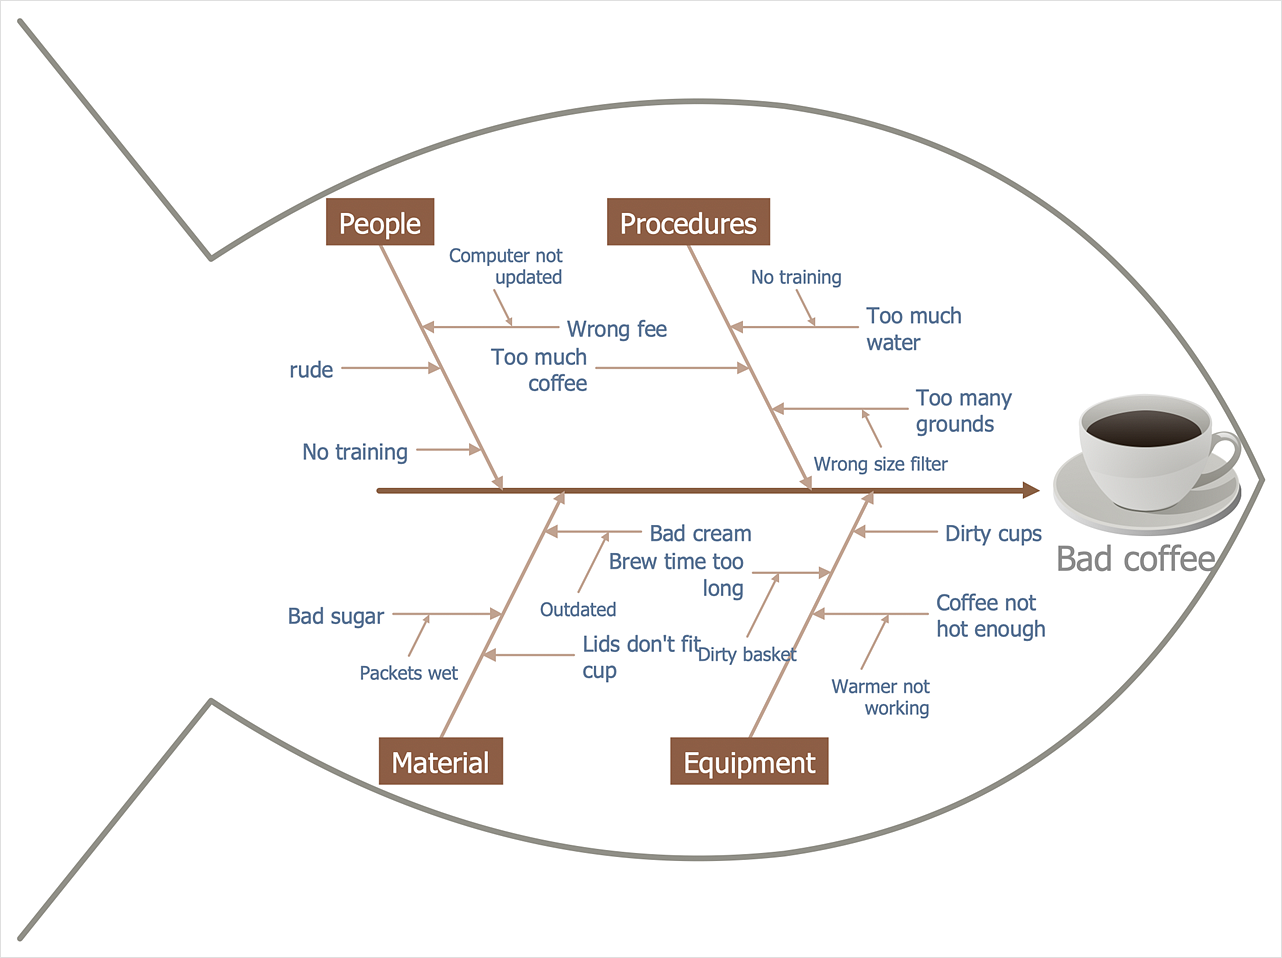
Fishbone (Ishikawa) Diagram is often used in business to determine the cause of some problem. A Fishbone diagram is also called the cause-and-effect diagram. The main goal of the Fishbone diagram is to illustrate in a graphical way the relationship between a given outcome and all the factors that influence this outcome. The complete diagram resembles a fish skeleton as its name implies. Cause and Effect analysis is used in management to identify the possible causes of a problem in order to eliminate them. The ability to create a Fishbone Diagram is supported by the Fishbone Diagram solution.Business Diagram Software
When managing the projects, people, or networks, there are daily designed and used different types of Business diagrams, so the powerful drawing software will be very useful for this. ConceptDraw DIAGRAM with large quantity of business solutions will meet your needs and will help you convey your ideas successful and rapidly, no matter are you professional or beginner. It is the best choice for business specialists and technical professionals who need quickly and easily explore, visualize, and communicate information. ConceptDraw DIAGRAM business diagram software is the most powerful business software and relational charting software. Create advanced, completely customizable Business Process Diagrams, Business Flow Charts, Work Flow Diagrams, Organizational Charts, Audit diagrams, Marketing diagrams, Value Stream Maps, TQM diagrams, ERD diagrams, EPC diagrams, Cause and Effect diagrams, Infographics, Dashboards, and other Relational business diagrams from your data using the powerful drawing tools of ConceptDraw Solution Park.
Export from ConceptDraw DIAGRAM Document to MS Visio® XML
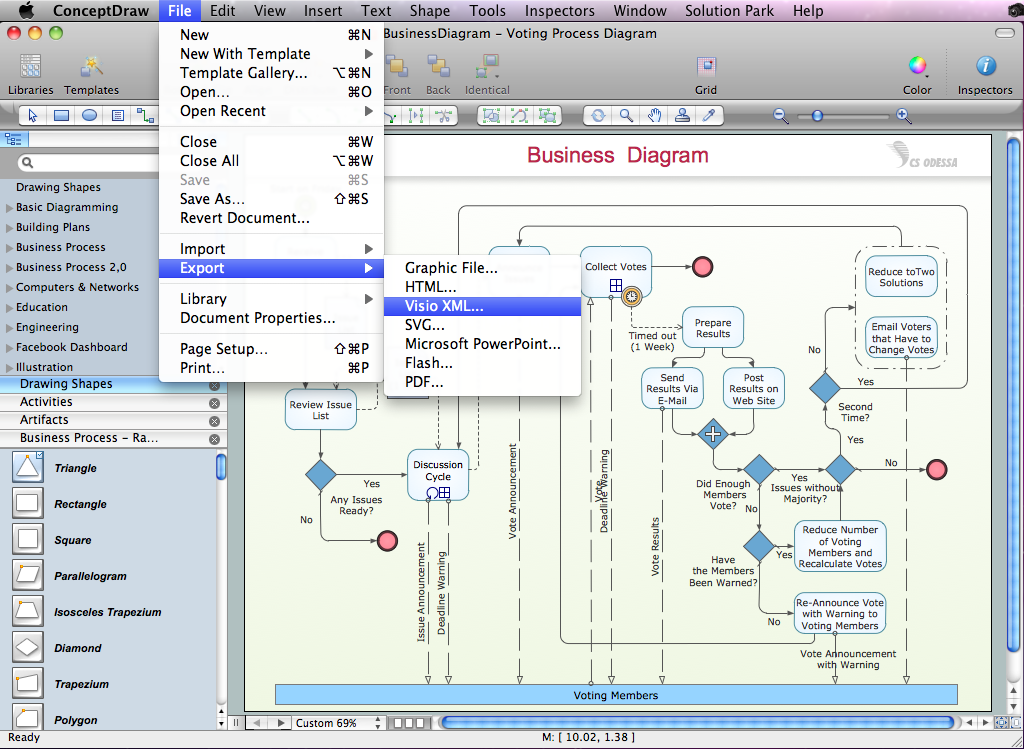
Once you have created your document in ConceptDraw DIAGRAM and you want to share it with your colleagues and friends, who uses MS Visio on their computers, you can easily export your document using ConceptDraw DIAGRAM export to Visio XML files (VDX) feature. Now you can share your ConceptDraw documents with MS Visio users.
 Food Court
Use the Food Court solution to create food art. Pictures of food can be designed using libraries of food images, fruit art and pictures of vegetables.
 Astronomy
Astronomy solution extends ConceptDraw DIAGRAM software with illustration and sketching software with templates, samples and libraries of a variety of astronomy symbols, including constellations, galaxies, stars, and planet vector shapes; a whole host of cele
 Computer Network Diagrams
Computer Network Diagrams solution extends ConceptDraw DIAGRAM software with samples, templates and libraries of vector icons and objects of computer network devices and network components to help you create professional-looking Computer Network Diagrams, to plan simple home networks and complex computer network configurations for large buildings, to represent their schemes in a comprehensible graphical view, to document computer networks configurations, to depict the interactions between network's components, the used protocols and topologies, to represent physical and logical network structures, to compare visually different topologies and to depict their combinations, to represent in details the network structure with help of schemes, to study and analyze the network configurations, to communicate effectively to engineers, stakeholders and end-users, to track network working and troubleshoot, if necessary.
- Fishbone Diagram | Total Quality Management TQM Diagrams ...
- Design elements - TQM diagram | Picture Graphs | Total Quality ...
- Manufacturing Pictures Diagram
- Tqm Chart
- Total Quality Management TQM Diagrams | TQM Diagram Example ...
- Probability Quality Control Tools | TQM Diagram Tool | TQM Diagram
- Images Of Fishbone Diagram
- Fishbone diagram - Causes of low-quality output
- Fishbone Diagram | Total Quality Management Business Diagram ...
- Design elements - TQM diagram | Total Quality Management TQM ...
- What is Infographics Area | Total Quality Management with ...
- Education | Presentations in Educational Process | Universal ...
- Fishbone Diagram | Fishbone diagram - Production process | Total ...
- Fishbone Diagram | Business Productivity Diagramming | Business ...
- Concept maps with ConceptDraw PRO | How to Draw a Flowchart ...
- Symbol Chart Of Mecinical Quality Management
- Using Fishbone Diagrams for Problem Solving | Cause and Effect ...
- Business Process Diagram | Fishbone Diagram | Business Process ...
- Fishbone Diagram | Cause and Effect Analysis ( Fishbone Diagrams ...
- Fishbone Diagram


