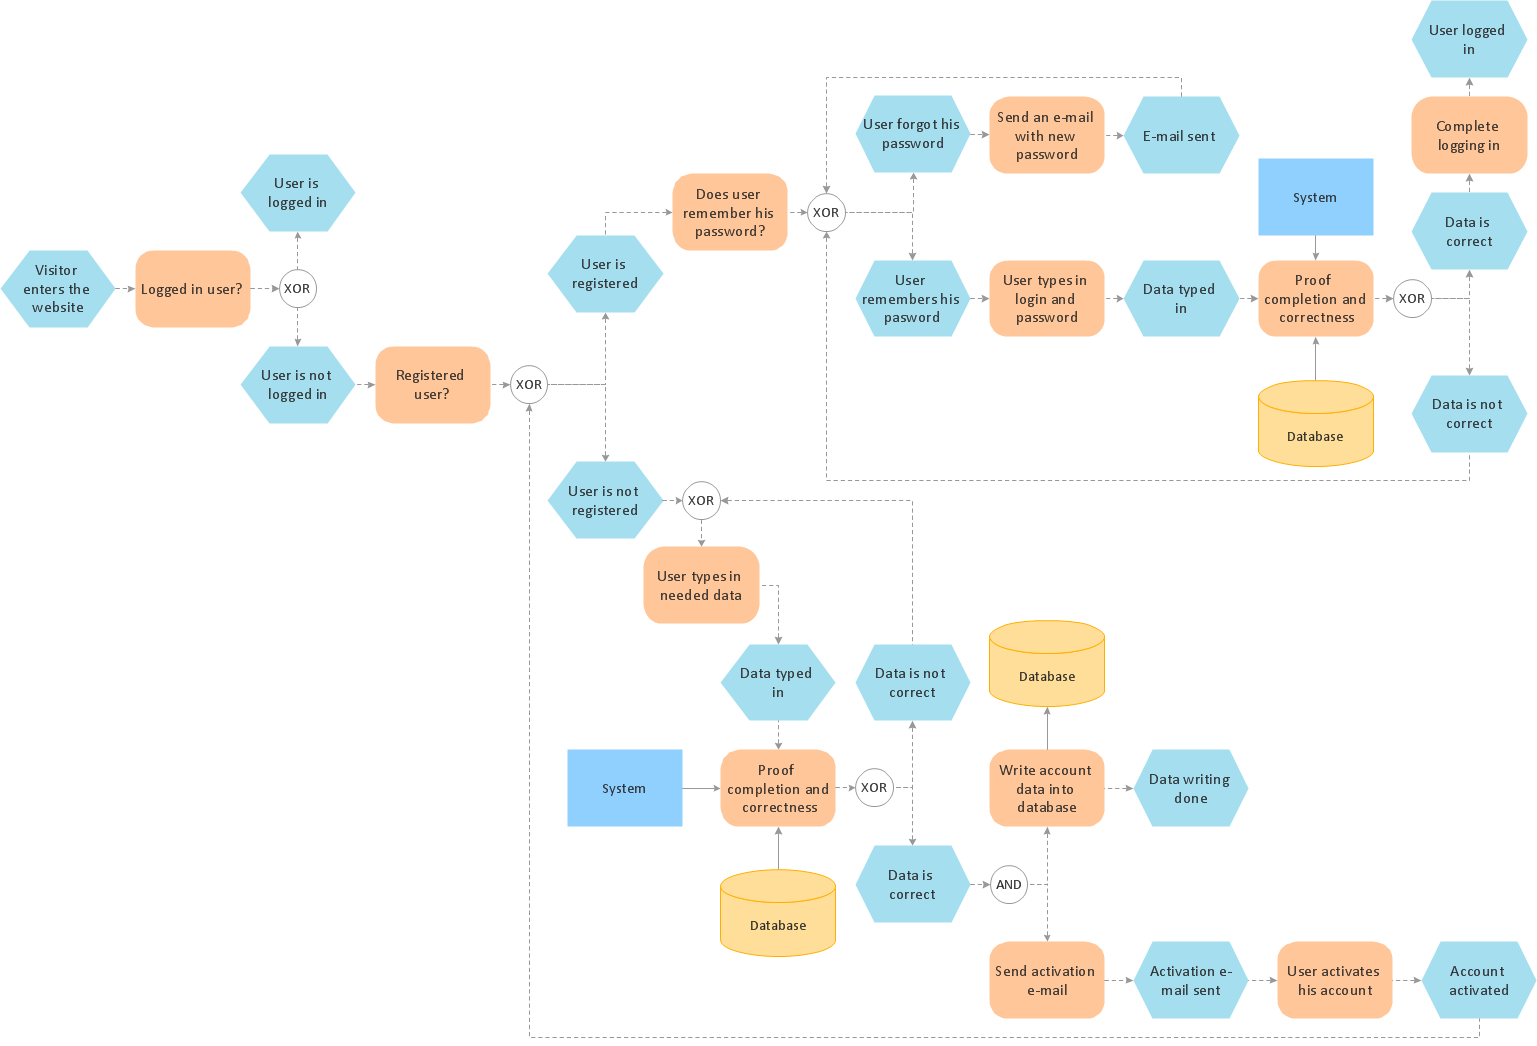
Business process Flow Chart — Event-Driven Process chain (EPC) diagrams
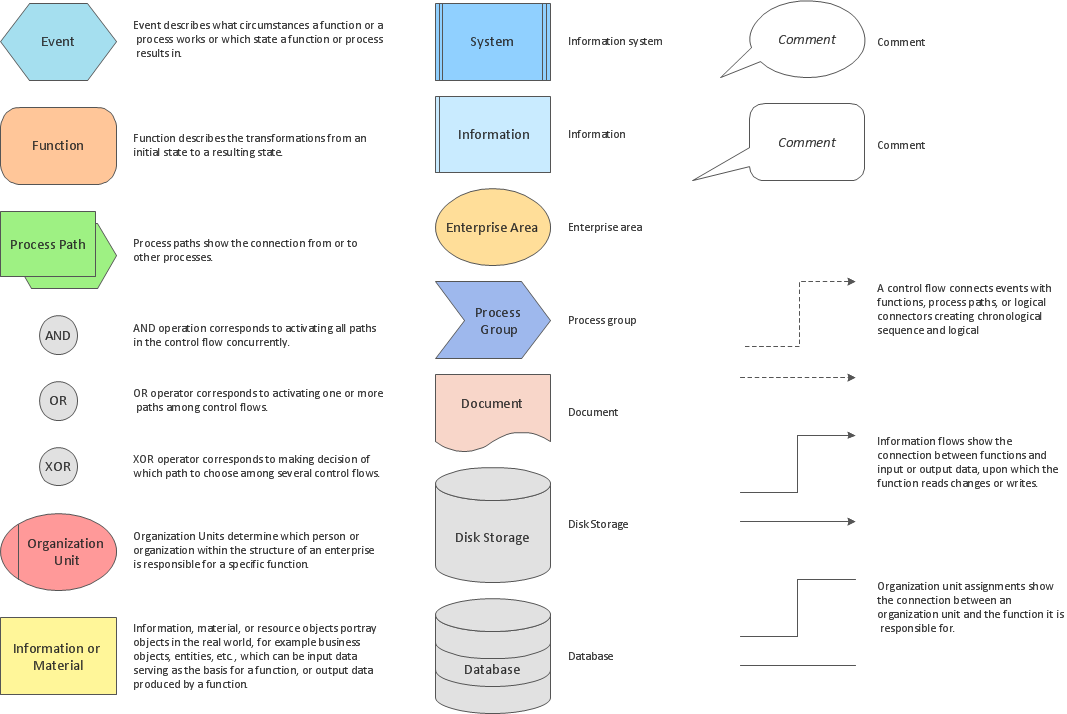
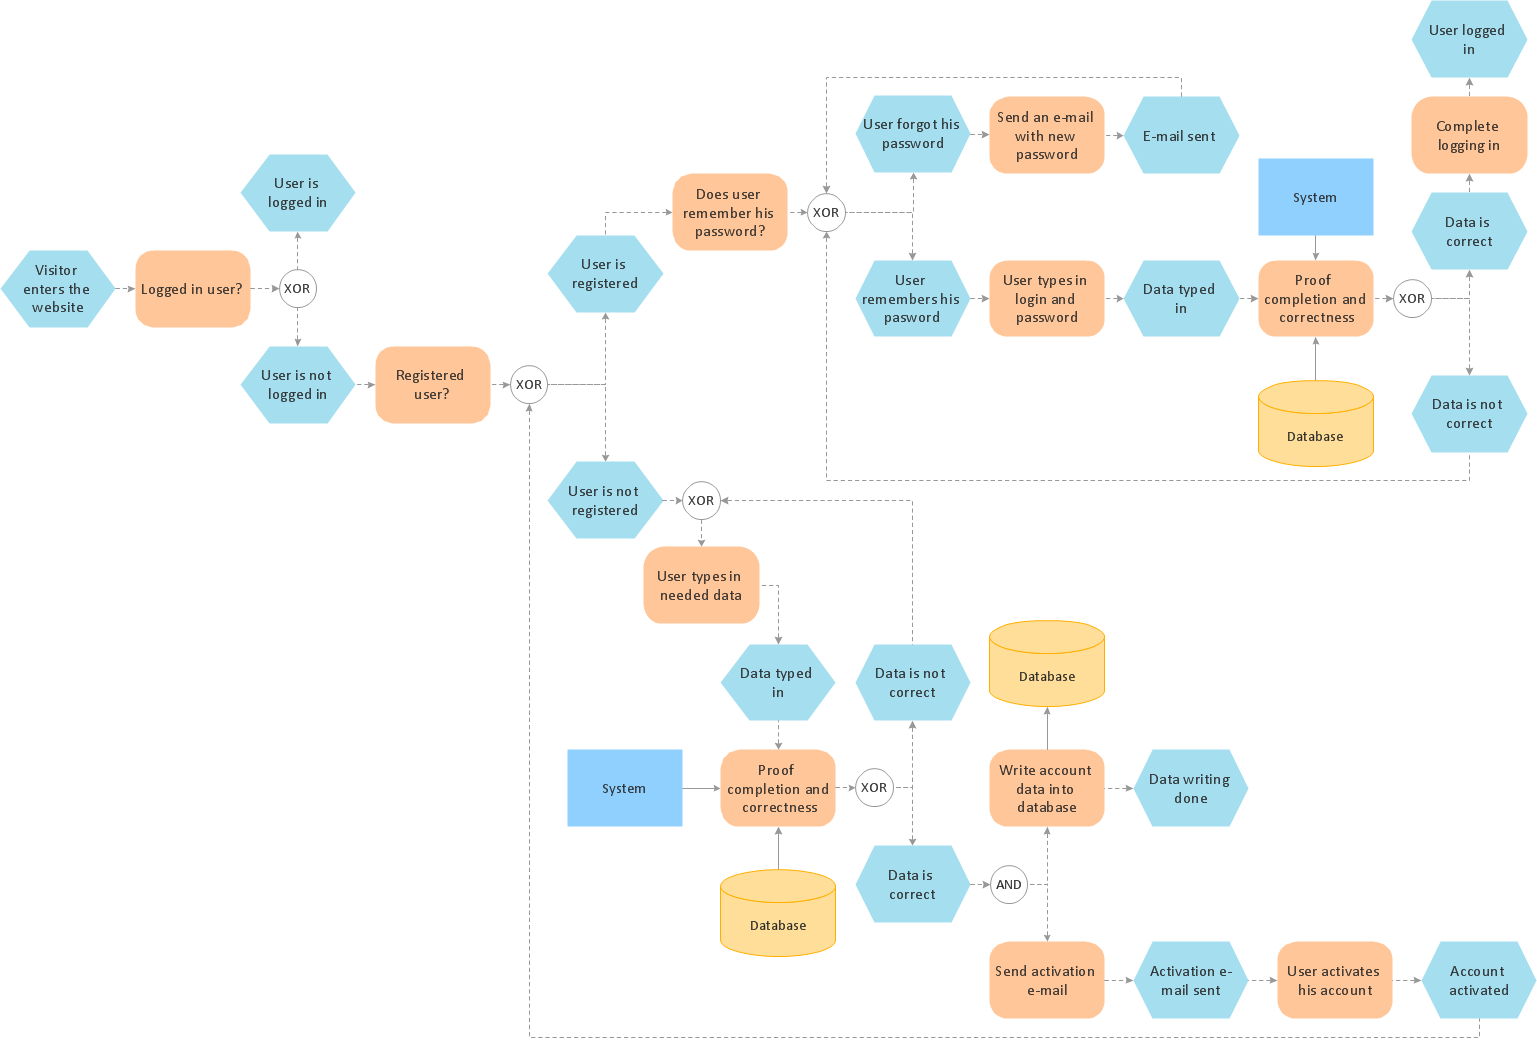
Event-Driven Process chain Diagrams for improvement throughout an organisation. Best software for Process Flow Diagram. The Event-driven Process Chain (EPC) Diagrams allows managers to plan processes and resources.An Event-driven Process Chain (EPC) - flowchart used for business process modelling
Event-Driven Process Chain flowcharts for improvement throughout an organisation. ConceptDraw PRO is a business process mapping software for making EPC flowcharts to provide business process modelling. Its excellent business process improvement tools.
 Cross-Functional Flowcharts
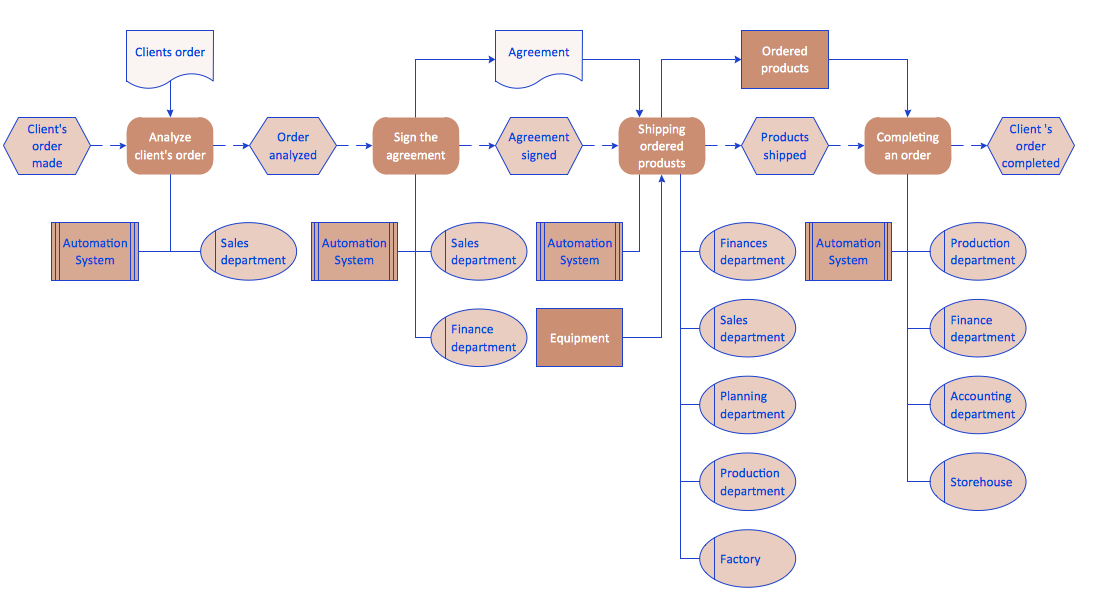
Cross-functional flowcharts are powerful and useful tool for visualizing and analyzing complex business processes which requires involvement of multiple people, teams or even departments. They let clearly represent a sequence of the process steps, the order of operations, relationships between processes and responsible functional units (such as departments or positions).
 Event-driven Process Chain Diagrams
Event-driven Process Chain (EPC) Diagram is a type of flowchart widely used for modeling in business engineering and reengineering, business process improvement, and analysis. EPC method was developed within the Architecture of Integrated Information Systems (ARIS) framework.
 Accounting Flowcharts
Accounting Flowcharts solution extends ConceptDraw PRO software with templates, samples and library of vector stencils for drawing the accounting flow charts.
Types of Flowcharts
A Flowchart is a graphical representation of process, algorithm, workflow or step-by-step solution of the problem. It shows the steps as boxes of various kinds and connects them by arrows in a defined order depicting a flow. There are twelve main Flowchart types: Basic Flowchart, Business Process Modeling Diagram (BPMN), Cross Functional Flowchart, Data Flow Diagram (DFD), IDEF (Integrated DEFinition) Flowchart, Event-driven Process Chain (EPC) Diagram, Influence Diagram (ID), Swimlane Flowchart, Process Flow Diagram (PFD), Specification and Description Language (SDL) Diagram, Value Stream Mapping, Workflow Diagram. Using the Flowcharts solution from the Diagrams area of ConceptDraw Solution Park you can easy and quickly design a Flowchart of any of these types. This solution offers a lot of special predesigned vector symbols for each of these widely used notations. They will make the drawing process of Flowcharts much easier than ever. Pay also attention for the included collection of ready Flowchart examples, samples and quick-start templates. This is business process improvement tools. If you are looking for MS Visio for your Mac, then you are out of luck, because it hasn't been released yet. However, you can use Visio alternatives that can successfully replace its functions. ConceptDraw PRO is an alternative to MS Visio for Mac that provides powerful features and intuitive user interface for the same.
EPC (Event-driven Process Chain) Flowcharts
The Event - driven Process Chain ( EPC ) allows managers visually present business process models for making decisions for business processes improvement. Event-Driven Process Сhain Diagrams for improvement throughout an organisation.Modelling Complex Events with Event-Driven Process chain
Event-Driven Process Chain Diagrams for improvement throughout an organisation. ConceptDraw PRO - software that reduces the time needed to create a business process model.EPC Diagrams Illustrate Business Process Work Flows
The Event-driven Process Chain ( EPC ) Diagrams allows users present business process models in terms of work flows. The EPC diagram can show various ways for improvement throughout an organisation.
 Business Processes
Business Process solution extends ConceptDraw PRO software with business process diagrams as cross-functional flowcharts, workflows, process charts, IDEF0, timelines, calendars, Gantt charts, business process modeling, audit and opportunity flowcharts.
Bar Diagrams for Problem Solving. Create event management bar charts with Bar Graphs Solution
Create bar charts for event management problem solving and visual data comparison using the ConceptDraw PRO diagramming and vector drawing software extended with the Bar Graphs Solution from the Graphs and Charts area of ConceptDraw Solition Park.Process Modelling using Event-driven Process chain
Event-Driven Process Chain Diagrams for improvement throughout an organisation. ConceptDraw PRO - business process mapping software that reduces the time needed to create a business process model and its excellent business process improvement tools.
 Business Processes Area
Solutions of Business Processes area extend ConceptDraw PRO software with samples, templates and vector stencils libraries for drawing business process diagrams and flowcharts for business process management.
"The general definition of an audit is a planned and documented activity performed by qualified personnel to determine by investigation, examination, or evaluation of objective evidence, the adequacy and compliance with established procedures, or applicable documents, and the effectiveness of implementation. The term may refer to audits in accounting, internal controls, quality management, project management, water management, and energy conservation.
Auditing is defined as a systematic and independent examination of data, statements, records, operations and performances (financial or otherwise) of an enterprise for a stated purpose. In any auditing the auditor perceives and recognizes the propositions before him for examination, collects evidence, evaluates the same and on this basis formulates his judgment which is communicated through his audit report. The purpose is then to give an opinion on the adequacy of controls (financial and otherwise) within an environment they audit, to evaluate and improve the effectiveness of risk management, control, and governance processes." [Audit. Wikipedia]
The audit flowchart example "Audit process flowchart" was created using the ConceptDraw PRO diagramming and vector drawing software extended with the Audit Flowcharts solution from the Finance and Accounting area of ConceptDraw Solution Park.
EPC - Business Processes in Terms of Work Flows
The Event-driven Process Chain ( EPC ) Diagrams allows users to present business process models in terms of work flows. The EPC diagram can shows various vayes how to reach positive company performance.The Best Tool for Business Process Modeling
The EPC diagram shows various business processes in terms of work flows. Event-Driven Process chain Diagrams for improvement throughout an organisation. ConceptDraw PRO - business process mapping software that reduces the time needed to create a business process model and is excellent business process improvement tools.
 Flowcharts
The Flowcharts solution for ConceptDraw PRO is a comprehensive set of examples and samples in several varied color themes for professionals that need to represent graphically a process. Solution value is added by the basic flow chart template and shapes' libraries of flowchart notation. ConceptDraw PRO flow chart creator lets one depict the processes of any complexity and length, as well as design the Flowchart either vertically or horizontally.
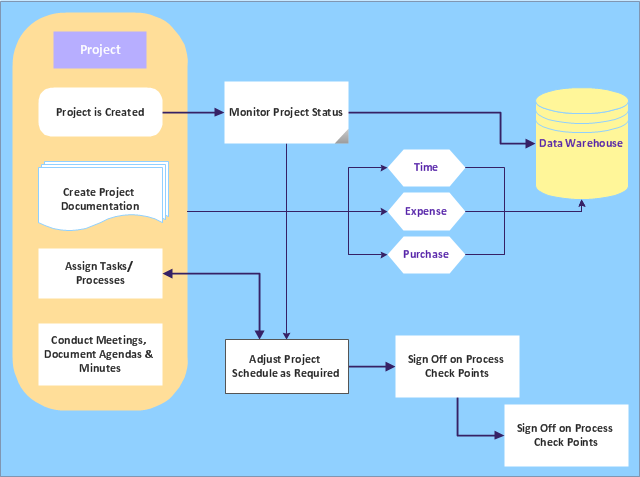
"A project management process is the management process of planning and controlling the performance or execution of a project. ...
Inputs:
(1) Documented need to act.
(2) Project plan templates.
(3) Lessons learned from previous projects.
(4) Existing project management standards.
(5) External information.
(6) Resources for project planning and project execution.
Process:
(1) Project initiation.
(2) Project planning.
(3) Project execution.
(4) Project control and validation.
(5) Project closeout.
Outputs:
(1) Project products delivered.
(2) Project objectives achieved (as a result of the interplay among project products and the organization or its environment).
(3) Lessons learned documented." [Project management process. Wikipedia]
The audit flowchart example "Project management process" was created using the ConceptDraw PRO diagramming and vector drawing software extended with the Audit Flowcharts solution from the Finance and Accounting area of ConceptDraw Solution Park.
www.conceptdraw.com/ solution-park/ finance-audit-flowcharts
Event Driven Process chain (EPC) Diagrams
Event-Driven Process Chain Diagrams for improvement throughout an organisation. ConceptDraw PRO - software that reduces the time needed to create a business process model.- Flow chart Example. Warehouse Flowchart | Flow process chart ...
- Business process Flow Chart - Event -Driven Process chain (EPC ...
- Business process Flow Chart - Event -Driven Process chain (EPC ...
- Purchase Process Flow Chart | Process Flowchart | How Do You ...
- Business process Flow Chart - Event -Driven Process chain (EPC)
- Flow Chart Diagram Examples | Business process Flow Chart ...
- Business process Flow Chart - Event -Driven Process chain (EPC ...
- Business process Flow Chart - Event -Driven Process chain (EPC)
- Business process Flow Chart - Event -Driven Process chain (EPC ...
- Business Process Diagram | Business process Flow Chart - Event ...
- Diagram Flow Chart | Business process Flow Chart - Event -Driven ...
- Example Process Flow | Best Program to Create a Fowchart ...
- Flow Diagram Software | Business process Flow Chart - Event ...
- Event -driven Process Chain Diagrams EPC | Cubetto Flowchart ...
- Event -driven Process Chain Diagrams EPC | Accounting Flowcharts ...
- Workflow Process Example | Event -driven Process Chain Diagrams ...
- Work Flow Process Chart | Flow Diagram Software | Business ...
- Business process Flow Chart - Event -Driven Process chain (EPC)
- Purchase Process Flow Chart | Flowchart Program Mac | Flow ...
- Cross-Functional Flowcharts | Opportunity flowchart - Order ...




.png--diagram-flowchart-example.png)
.png--diagram-flowchart-example.png)
.png--diagram-flowchart-example.png)


