Quality Engineering Diagrams
Create Quality Engineering Diagrams (value stream maps) - for value stream analysis and value stream management, material and information flow mapping, using our quick start templates included with ConceptDraw.
 Quality Mind Map
This solution extends ConceptDraw MINDMAP software with Quality Management Mind Maps (Presentations, Meeting Agendas, Problem to be solved).
 Engineering
This solution extends ConceptDraw PRO v9.4 with the ability to visualize industrial systems in electronics, electrical, chemical, process, and mechanical engineering.
 Mechanical Engineering
This solution extends ConceptDraw PRO v.9 mechanical drawing software (or later) with samples of mechanical drawing symbols, templates and libraries of design elements, for help when drafting mechanical engineering drawings, or parts, assembly, pneumatic,
 Electrical Engineering
This solution extends ConceptDraw PRO v.9.5 (or later) with electrical engineering samples, electrical schematic symbols, electrical diagram symbols, templates and libraries of design elements, to help you design electrical schematics, digital and analog
 Chemical and Process Engineering
This chemical engineering solution extends ConceptDraw PRO v.9.5 (or later) with process flow diagram symbols, samples, process diagrams templates and libraries of design elements for creating process and instrumentation diagrams, block flow diagrams (BFD
 Software Development Area
Solutions from the Software Development Area of ConceptDraw Solution Park collect templates, samples and libraries of vector stencils for drawing the software engineering diagrams and user interface design prototypes.
Mechanical Drawing Symbols
Mechanical Drawings are the special type of technical diagrams that visualize the structure of complex systems and illustrate the information about ventilation, heating, air conditioning, i.e. HVAC systems. These drawings are created on the base of floor plans and reflected ceiling plans, and then become an obligatory part of construction project which is needed directly for construction a building and for receiving a permit on it. Mechanical drawings and diagrams help effectively represent construction, technical and engineering solutions, and also schematics of different mechanical equipment. ConceptDraw PRO vector drawing software enhanced with Mechanical Engineering solution from Engineering area of ConceptDraw Solution Park provides wide set of effective drawing tools, predesigned mechanical drawing symbols, templates, samples and examples. Use of standardized and recognized mechanical vector symbols helps you design understandable mechanical drawings, diagrams and mechanical engineering schematics.HelpDesk
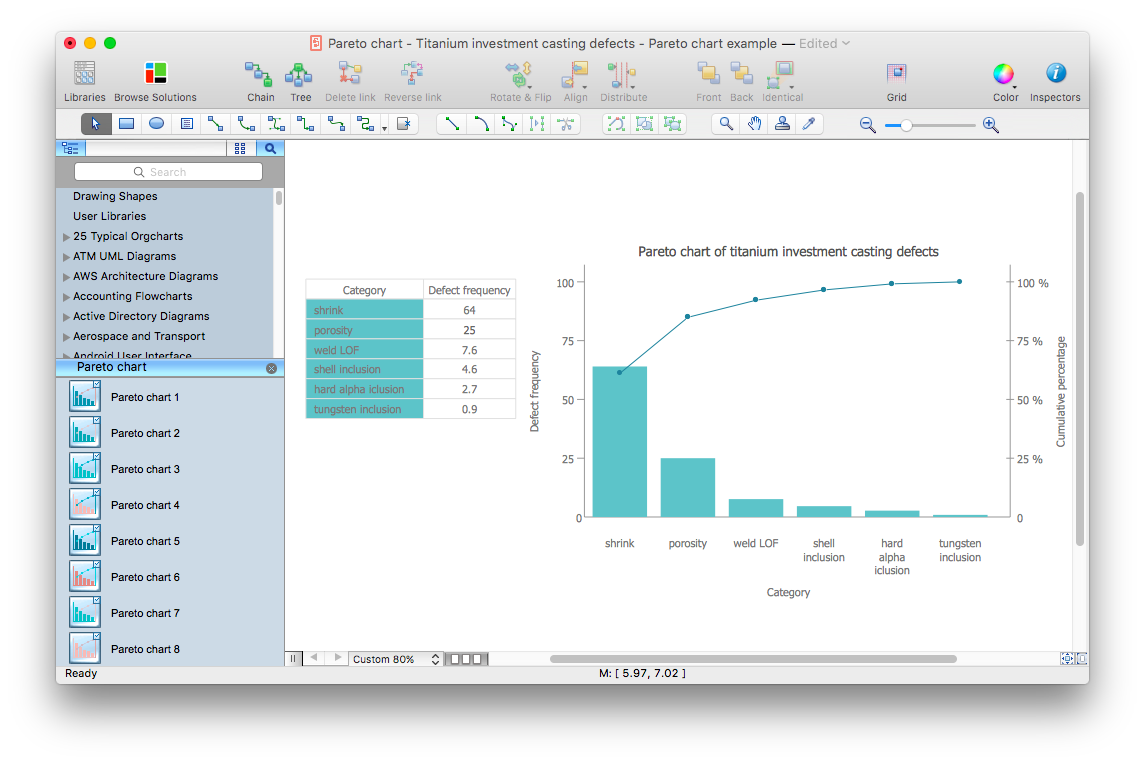
How to Draw a Pareto Chart Using ConceptDraw PRO
The Seven Basic Tools of Quality were picked as effective visual tool-set for identifying the root cause of quality-related problems within the workplace. Seven Basic Tools of Quality comprise of seven diagram that are diverse enough to be used to any business troubleshooting scenario, but simple enough that employees of all types can understand and apply them. One of these tools is a Pareto chart. It combines both a line graph and a bar chart, where the bar chart displays data values, and a line represents a total value. Pareto chart is used for quality control to identify the source of the quality problem.ConceptDraw Seven Basic Tools of Quality solution delivers a big set of vector stencil libraries and samples for each quality control diagram, including a Pareto chart.
ConceptDraw PRO 9 Comparison with Omnigraffle Professional and MS Visio
ConceptDraw PRO 9 Comparison with Omnigraffle Professional and MS Visio. All source ConceptDraw documents are vector graphic documents. They are available for reviewing, modifying, or converting to a variety of formats: PDF file, MS PowerPoint, MS Visio, and many other graphic formats.
 Universal Diagramming Area
This area collects solutions for drawing diagrams, charts, graphs, matrices, geographic and road maps for education, science, engineering, business.
HelpDesk
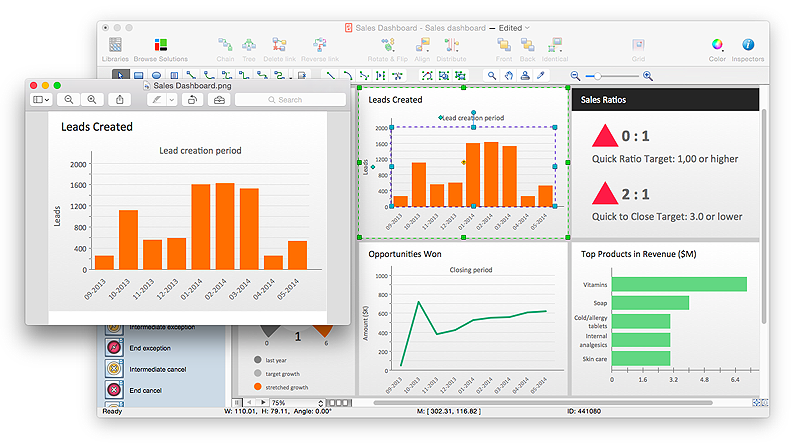
How to Save a Drawing as a Graphic File in ConceptDraw PRO
ConceptDraw PRO can save your drawings and diagrams in a number of highly useful formats, including graphic files. You can save your drawing as a .PNG, .JPG, or other graphic format file.S Video Connection
S-Video is a signaling standard for standard definition video. ConceptDraw PRO diagramming and vector drawing software extended with Audio and Video Connectors Solution from the Engineering Area can be helpful for demostrating and explaining the S Video connection which is widely used on TVs and home theater receivers.HelpDesk
How to Draw a Scatter Diagram Using ConceptDraw PRO
Scatter Diagrams are used to visualize how a change in one variable affects another. A Scatter Diagram displays the data as a set of points in a coordinate system. It combines these values into single data points and displays them in uneven intervals. A Scatter Diagram can be very useful to for identifying relationships between variables, for example the relationship of price and quality rating. Making a Scatter Diagram involves many different elements that can be managed using ConceptDraw Scatter Diagram solution.Audio Connectors
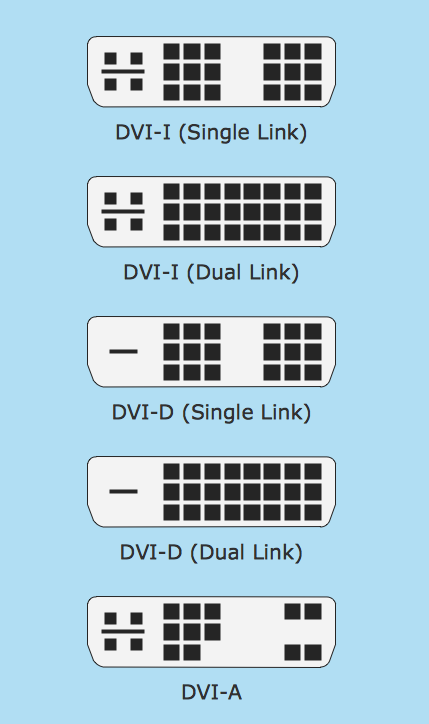
Audio connectors are electrical connectors designed and used for audio frequencies. ConceptDraw PRO diagramming and vector drawing software extended with Audio and Video Connectors Solution from the Engineering Area is the best for drawing various audio schematics with detailed illustration the audio connectors.- Quality Engineering Diagrams | Entity Relationship Diagram ...
- Quality Engineering Diagrams | Seven Management and Planning ...
- Value Stream Mapping | VSM | Quality Engineering Diagrams | Vsm ...
- Process Flowchart | Quality Engineering Diagrams | Types of ...
- Entity Relationship Diagram Software Engineering | Quality ...
- Value Stream Mapping | Quality Engineering Diagrams | VSM ...
- Entity Relationship Diagram Software Engineering | Electrical ...
- Cause and Effect Analysis (Fishbone Diagrams ) | How To Create ...
- Entity Relationship Diagram Software Engineering | Mechanical ...
- Process Flowchart | Quality Engineering Diagrams | ConceptDraw ...
- Building Drawing Design Element: Piping Plan | Quality Engineering ...
- Value Stream Mapping | Quality Engineering Diagrams | Value ...
- Draw The Flow Chart In The Tools For Quality Control And Explain
- Value Stream Mapping | Lean Manufacturing Diagrams | Quality ...
- Value Stream Mapping For Quality
- Lean Manufacturing Diagrams | Best Value Stream Mapping mac ...
- Value Stream Mapping
- Block Diagram Of Quality Engineering
- Process Flowchart | How to Draw a Process Flow Diagram in ...
- How to Draw a Chemical Process Flow Diagram | Workflow Diagram ...


