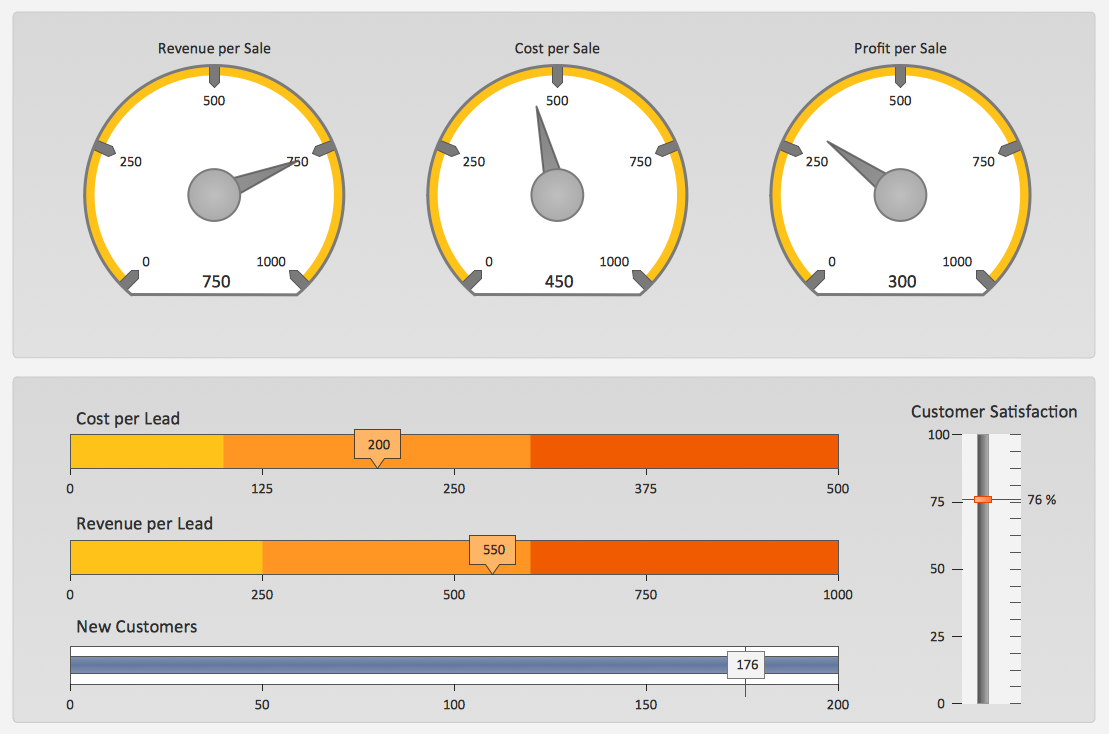
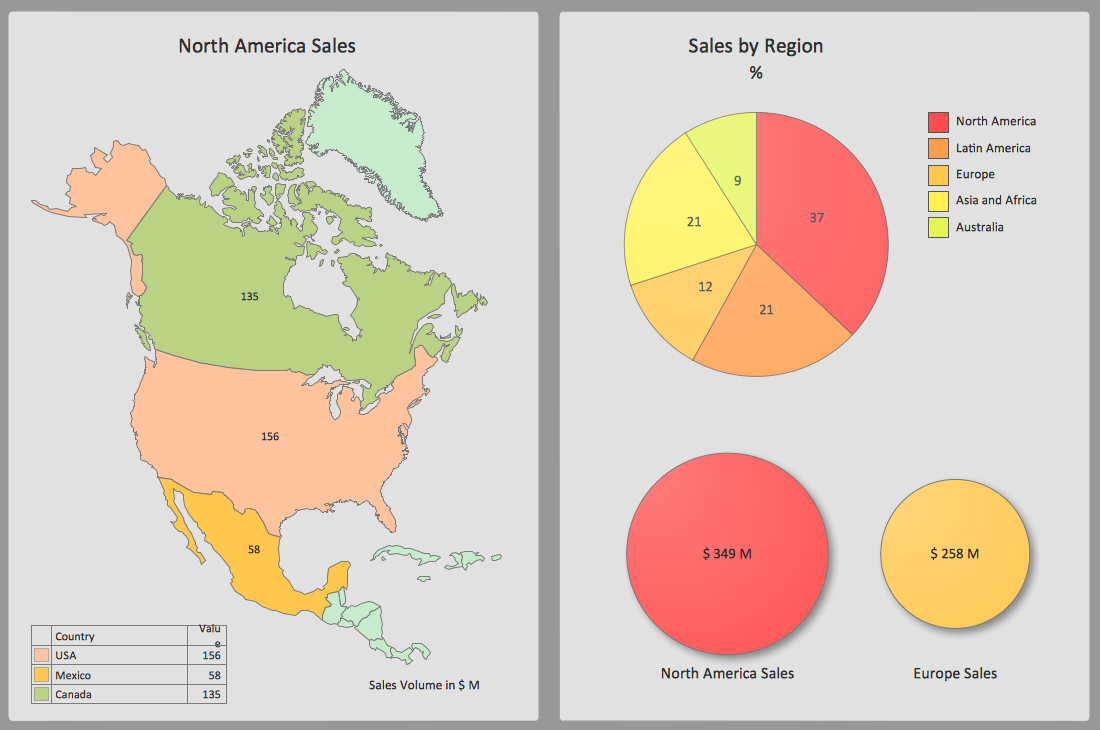
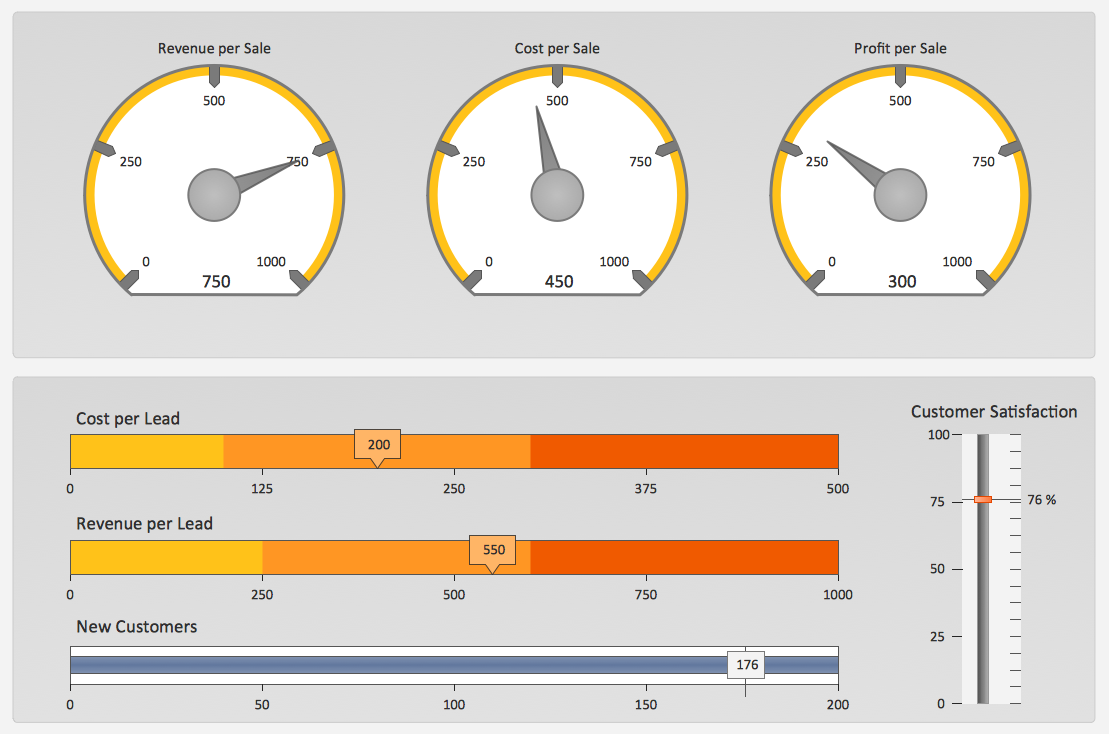
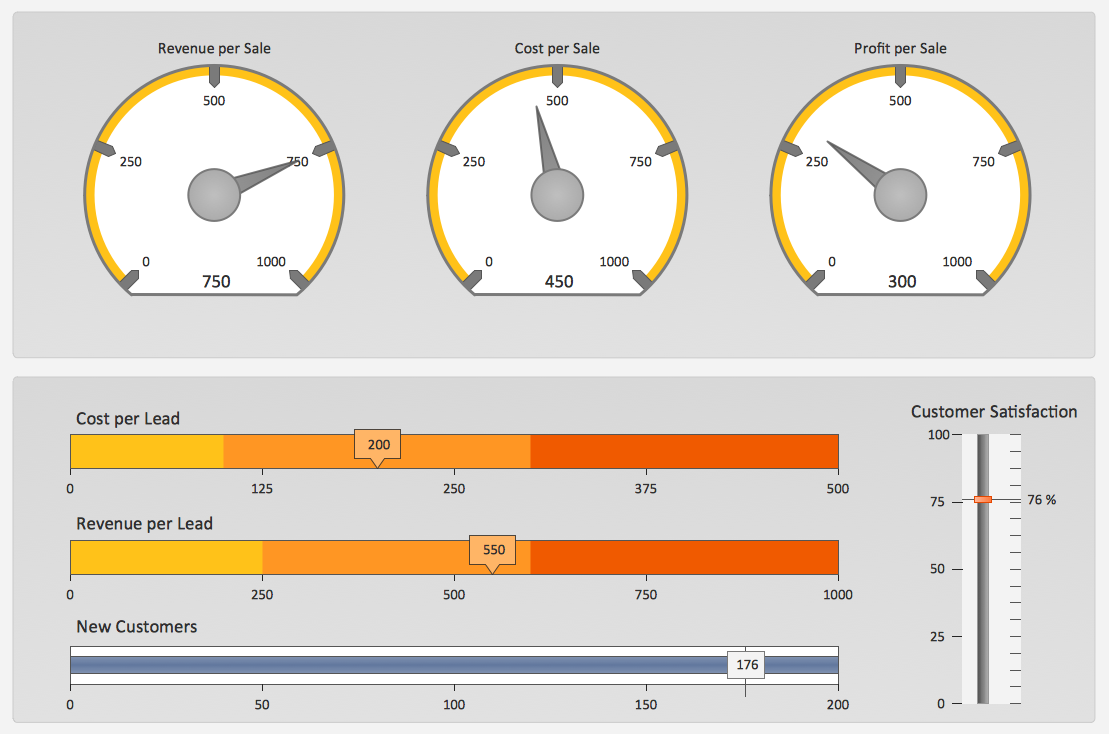
Sales Dashboard Template
ConceptDraw PRO software extended with the Sales Dashboard solution delivers a complete set of samples, templates and pre-designed objects you need for visualizing sales data.Sales Dashboard Examples
Visualizing sales data you may need a good example to start. ConceptDraw Sales Dashboard solution delivers a complete set of templates and samples you can use as examples to start composing your own sales dashboard.
 Meter Dashboard
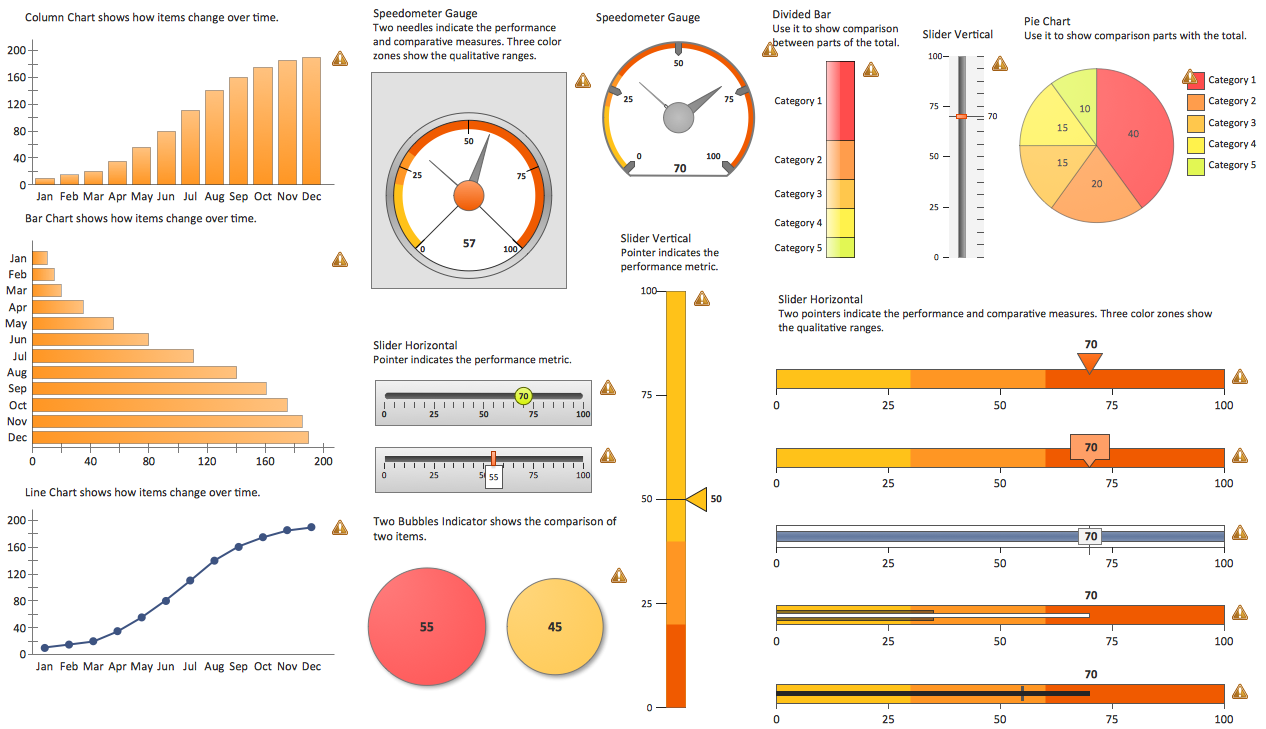
Meter dashboard solution extends ConceptDraw PRO software with templates, samples and vector stencils library with meter indicators for drawing visual dashboards showing quantitative data.
Visualize Sales Data Using Sample Data
ConceptDraw PRO software extended with the Sales Dashboard solution allows you visualize sales data using sample data delivered with the solution to choose visual indicators you need, and then connect these indicators to your real data.HelpDesk
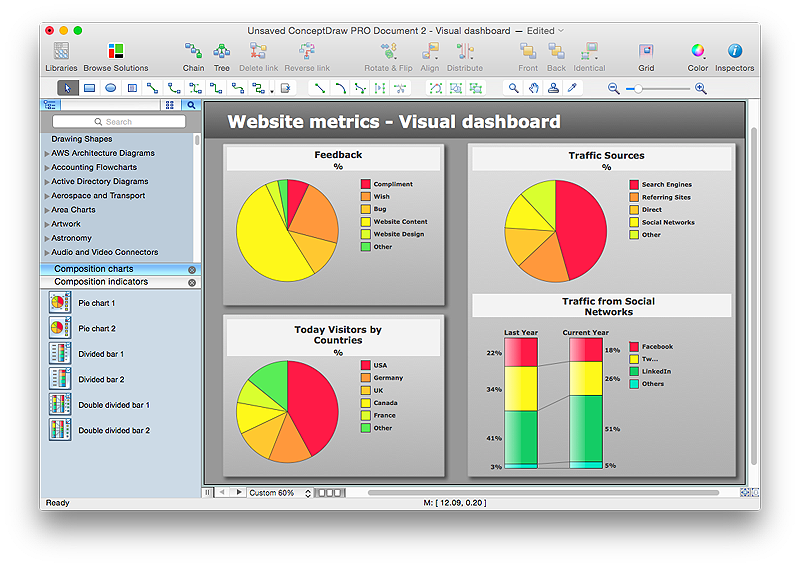
How to Connect a Live Object to a Text Data Source
Instruction on how to connect a ConceptDraw live object with data source files in TXT format to visualize the actual values of your performance metrics.
A KPI Dashboard
Composing a dashboard from different KPI is a kind of art. Visualizing sales data you have to keep balance to keep your dashboard informative, not messy. ConceptDraw Sales Dashboard solution gives you a set of good examples of balanced dashboards.
 Status Dashboard
Status dashboard solution extends ConceptDraw PRO software with templates, samples and vector stencils libraries with graphic indicators for drawing the visual dashboards showing status data.
Sales Dashboard Solutions can help your sales team keep an eye on performance
ConceptDraw Sales Dashboard Solution is a simple and effective way of visualizing sales data and get clear picture of your sales process to see how your business can improve.
 Sales Dashboard
Sales Dashboard solution extends ConceptDraw PRO software with templates, samples and library of vector stencils for drawing the visual dashboards of sale metrics and key performance indicators (KPI).
Data Visualization Software Solutions
To see how your business can improve you can try data visualization software solutions that allows you visualize all your sales KPI in one sales dashboard allows you monitor and analyse sales activities.
 Time Series Dashboard
Time series dashboard solution extends ConceptDraw PRO software with templates, samples and vector stencils libraries with charts, graphs and plots for drawing the visual dashboards showing data time series.
HelpDesk
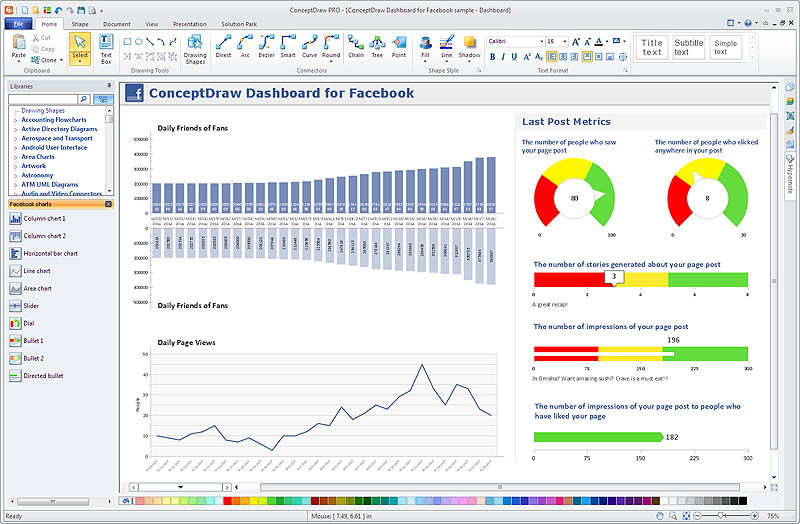
How to Use ConceptDraw Dashboard for Facebook on PC
The ConceptDraw Dashboard for Facebook Solution is a visual dashboard that visualizes lifetime total Likes, daily Friends of Fans, and daily Page views based on the information exported from your Facebook Page.Sales Dashboards for Your Company
ConceptDraw PRO software extended with the Sales Dashboard solution allows you produce sales dashboards for your company easily. You can start from samples and templates delivered with the solution and then modify them to get a dashboard that suites your specific needs.
 Frequency Distribution Dashboard
Frequency distribution dashboard solution extends ConceptDraw PRO software with samples, templates and vector stencils libraries with histograms and area charts for drawing the visual dashboards showing frequency distribution of data.
 Correlation Dashboard
Correlation dashboard solution extends ConceptDraw PRO software with samples, templates and vector stencils library with Scatter Plot Charts for drawing the visual dashboard visualizing data correlation.
- Project Business Dashboard Examples
- Sales Dashboard Template | Meter Dashboard | Sales Dashboard ...
- Sales Dashboard Examples | Meter Dashboard | Business Process ...
- Support calls by products - Business dashboard | Reporting ...
- Sales Dashboard Template | Sales Dashboard - Access Anywhere ...
- Business Kpi Metrics Samples
- Reporting Dashboard Software for Business | Dashboard Software ...
- Business Graphics Software | KPI Dashboard | Sales Dashboards ...
- Sales Dashboard Template | Sales KPI Dashboards | Visualize ...
- What is a KPI? | Sales Dashboard | KPI Dashboard | Sample Kpis ...
- Meter Dashboard | What is a Dashboard Area | Business Graphics ...
- KPI Dashboard | What is a KPI? | Sales Dashboard Template | Kpi ...
- Kpi Dashboard Examples
- Sales Dashboard Template | Visualize Sales Data Using Sample ...
- Enterprise dashboard | Business Graphics Software | Visual ...
- Sales Dashboard Template | Sales Dashboard Examples | Visualize ...
- Sales Dashboard | Sales Process Flowchart. Flowchart Examples ...
- Business Productivity Area | PM Dashboards | Meter Dashboard ...
- Sales Dashboards for Your Company | Frequency Distribution ...
