 Cross-Functional Flowcharts
Cross-functional flowcharts are powerful and useful tool for visualizing and analyzing complex business processes which requires involvement of multiple people, teams or even departments. They let clearly represent a sequence of the process steps, the order of operations, relationships between processes and responsible functional units (such as departments or positions).
HelpDesk
How to Connect Text Data to a Time Series Chart on Your Live Dashboard
Time Series Dashboard means an integration of some type of diagrams: Line Charts, Bar Charts, Column Charts, and Dot Plots on a single space. The ConceptDraw Time Series Dashboard solution can be used to create the interactive Time Series dashboard. The libraries of Time Series Charts solution contain the Live Objects, that can change their appearance depending on the external data. Each chart from the Time Series dashboard displays particular source data. You can include Time Series Charts in your business or technical dashboards to show and compare the items changing over time.
 HVAC Plans
Use HVAC Plans solution to create professional, clear and vivid HVAC-systems design plans, which represent effectively your HVAC marketing plan ideas, develop plans for modern ventilation units, central air heaters, to display the refrigeration systems for automated buildings control, environmental control, and energy systems.
HelpDesk
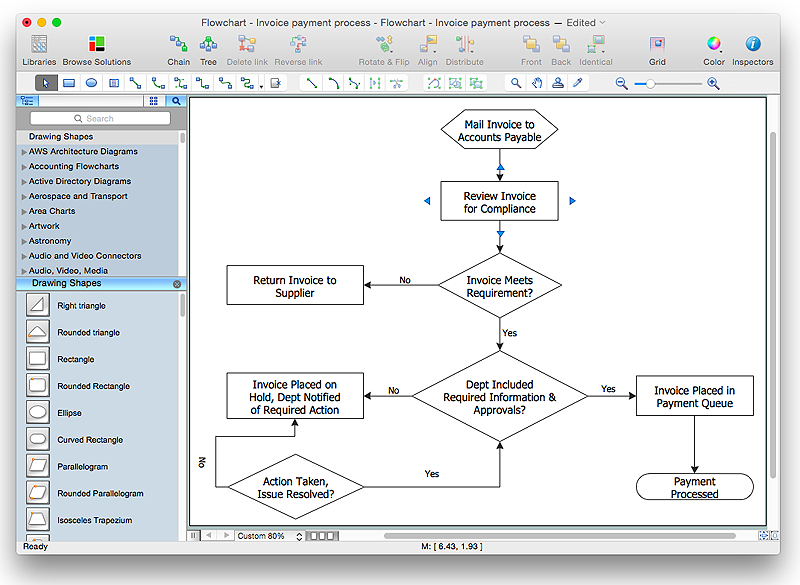
How to Simplify Flow Charting in ConceptDraw PRO on OS X
Flowchart is a great way to present any complex process in a simple to understand manner. Flowchart is perhaps the most common form of diagrams used in both technical and social fields. Since a flow chart is a method that allows to describe visually any consequent process, it can be used to show the flow of logic of any process. In ConceptDraw PRO it really is simple to draw even the most complex flowcharts. Use the RapidDraw technology for the best results.HelpDesk
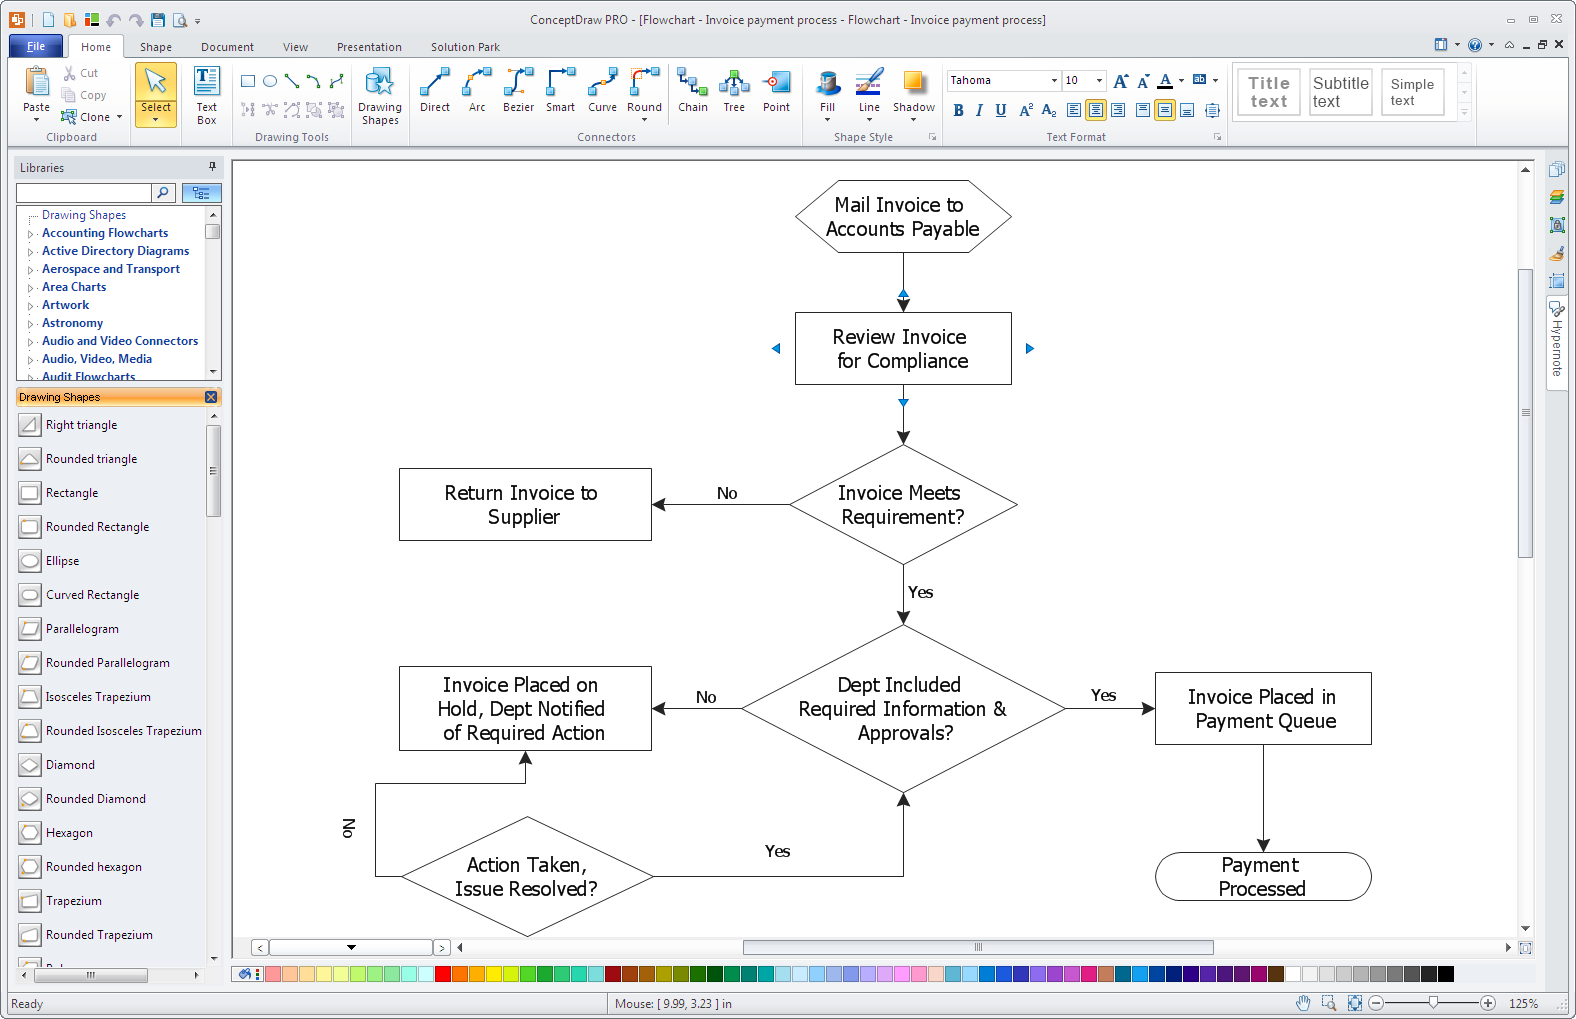
How to Simplify Flow Charting in ConceptDraw PRO on Windows
Flowcharts are a best tool for staking out a huge and complex process into some small readable parts. The use of standard symbols that make it clear for a wide audience makes a software tool preferred for this task. The core for a successful flowchart is its simplicity. That is why often before beginning making flowchart through software, people draw the scetch on a piece of paper. Designing an effective flowchart means the combination of the data needed to be shown and the simplicity with which you depict it. In ConceptDraw PRO it really is sp simple to draw even the most complex flowcharts. Use the RapidDraw technology for the best results.
 ConceptDraw Solution Park
ConceptDraw Solution Park collects graphic extensions, examples and learning materials
 eLearning for Skype
This solution extends ConceptDraw MINDMAP software with the ability to prepare and run remote learning sessions by using Skype
HelpDesk
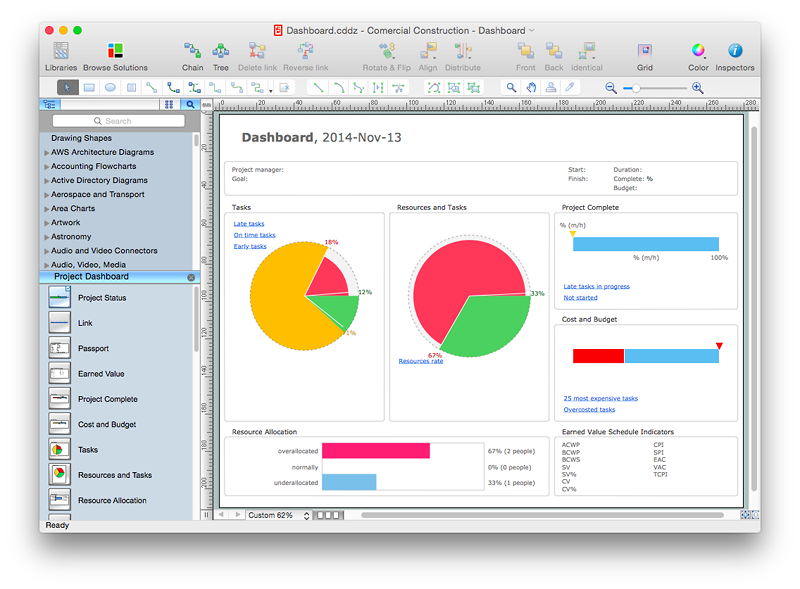
How to Create Project Dashboard on Mac
The visual Project Dashboard within ConceptDraw Office is the best way to deliver a clear view of project performance to all project participants.
 IDEF Business Process Diagrams
Use the IDEF Business Process Diagrams solution to create effective database designs and object-oriented designs, following the integration definition methodology.
 Venn Diagrams
Venn Diagrams are actively used to illustrate simple set relationships in set theory and probability theory, logic and statistics, mathematics and computer science, linguistics, sociology, and marketing. Venn Diagrams are also often used to visually summarize the status and future viability of a project.
 Business Process Mapping
The Business Process Mapping solution for ConceptDraw PRO is for users involved in process mapping and creating SIPOC diagrams.
 Football
The Football Solution extends ConceptDraw PRO v9.5 (or later) software with samples, templates, and libraries of vector objects for drawing football (American) diagrams, plays schemas, and illustrations. It can be used to make professional looking documen
 Value Stream Mapping
Value stream mapping solution extends ConceptDraw PRO software with templates, samples and vector stencils for drawing the Value Stream Maps (VSM) in lean manufacturing practice.
 Mechanical Engineering
This solution extends ConceptDraw PRO v.9 mechanical drawing software (or later) with samples of mechanical drawing symbols, templates and libraries of design elements, for help when drafting mechanical engineering drawings, or parts, assembly, pneumatic,
- Sales Dashboard Examples | Meter Dashboard | Sales Dashboard ...
- Pie Chart Examples | Pie Chart Software | Basic Diagramming ...
- Kpi Dashboard Requirements Document Template
- Sales Dashboard Template | Sales Dashboard Examples | Meter ...
- Histograms | Visual Presentations Made Easy with Diagramming ...
- Dashboard Software | Reporting Dashboard Software for Business ...
- Sales Dashboard Template | Sales Dashboard - Access Anywhere ...
- Business Graphics Software | Meter Dashboard | Sales Dashboards ...
- Kpi Sample Template Ppowerpoint
- Basic Flowchart Images. Flowchart Examples | Business and ...
- Reporting Dashboard Software for Business | Dashboard Software ...
- Sales Dashboard Template | Meter Dashboard | Sales Dashboard ...
- UML Use Case Diagram Example Social Networking Sites Project ...
- Support calls by products - Business dashboard | Reporting ...
- Sales Dashboard - Access Anywhere | Sales Dashboard Template ...
- Performance Dashboard Templates
- Histogram Business Example
- How to Create Project Dashboard on Mac | Pie Charts | How to Use ...
- Meter Dashboard | What is a Dashboard Area | Business Graphics ...
- Meter Dashboard | Sales Dashboard - Access Anywhere | Business ...


