UML Class Diagram Example for Transport System
This sample was created in ConceptDraw PRO diagramming and vector drawing software using the UML Class Diagram library of the Rapid UML Solution from the Software Development area of ConceptDraw Solution Park. This sample shows the transport protocol mappings for SNMP (Simple Network Management Protocol), the classes of the transport system and relationships between them and is used in IP network.UML Class Diagram Example for GoodsTransportation System
Class Diagram for Goods Transport System in UML. This sample was created in ConceptDraw PRO diagramming and vector drawing software using the UML Class Diagram library of the Rapid UML Solution from the Software Development area of ConceptDraw Solution Park. This sample shows the concept of working of the transport company and is used by transport companies, carriers at the transportation of various goods.UML Class Diagram Example - Apartment Plan
UML Apartment Plan. This sample was created in ConceptDraw PRO diagramming and vector drawing software using the UML Class Diagram library of the Rapid UML Solution from the Software Development area of ConceptDraw Solution Park. This sample show the detailed plan of the apartment and is used by building companies, design apartments, real estate agencies, at the buying / selling of the realty.UML Class Diagram Generalization Example UML Diagrams
This sample was created in ConceptDraw PRO diagramming and vector drawing software using the UML Class Diagram library of the Rapid UML Solution from the Software Development area of ConceptDraw Solution Park. This sample describes the use of the classes, the generalization associations between them, the multiplicity of associations and constraints. Provided UML diagram is one of the examples set that are part of Rapid UML solution.
 Fishbone Diagram
Fishbone Diagrams solution extends ConceptDraw PRO software with templates, samples and library of vector stencils for drawing the Ishikawa diagrams for cause and effect analysis.
 Aerospace and Transport
This solution extends ConceptDraw PRO software with templates, samples and library of vector clipart for drawing the Aerospace and Transport Illustrations. It contains clipart of aerospace objects and transportation vehicles, office buildings and anci
 Entity-Relationship Diagram (ERD)
An Entity-Relationship Diagram (ERD) is a visual presentation of entities and relationships. That type of diagrams is often used in the semi-structured or unstructured data in databases and information systems. At first glance ERD is similar to a flowch
Marketing - Design Elements
If you need to pull together a quick marketing drawing, you'll find elements, samples, templates and libraries with vector clip art for drawing the Marketing Illustrations. These symbols and signs you can use in your design for Strategic Marketing, Graphic Design, Inbound and Content Marketing, Social Media, Lead Generation, Email Marketing and Automation, CRM implementation and Integration and more. This symbols used for marketing presentation, project management report, project management tracking tools and other types of creative project management software.Design Pictorial Infographics. Design Infographics
In the course of recent decades data visualization went through significant development and has become an indispensable tool of journalism, business intelligence and science. The way visual information may be conveyed is not limited simply to static or dynamic representation, it can also be interactive. Infographics can be conditionally divided into several general levels. Primarily, this is level of visualization of information, its interpretation and association on any ground. Second level can be defined as a visualization of knowledge, depiction of thoughts and ideas in the form of images or diagrams. Finally, the level of data visualization, which processes data arrays in charts, enabling the information to be more clearly perceived. You can also identify the main approaches to the creation of infographics: exploratory and narrative. Exploratory method insists on minimalist design in favor of data precision without unnecessary details and is common for scientific researches and ana
 Metro Map
Metro Map solution extends ConceptDraw PRO software with templates, samples and library of vector stencils for drawing the metro maps, route maps, bus and other transport schemes, or design tube-style infographics.
 Data Flow Diagrams (DFD)
Data Flow Diagrams solution extends ConceptDraw PRO software with templates, samples and libraries of vector stencils for drawing the data flow diagrams (DFD).
 Entity-Relationship Diagram (ERD)
Entity-Relationship Diagram (ERD) solution extends ConceptDraw PRO software with templates, samples and libraries of vector stencils from drawing the ER-diagrams by Chen's and crow’s foot notations.
Timing diagram
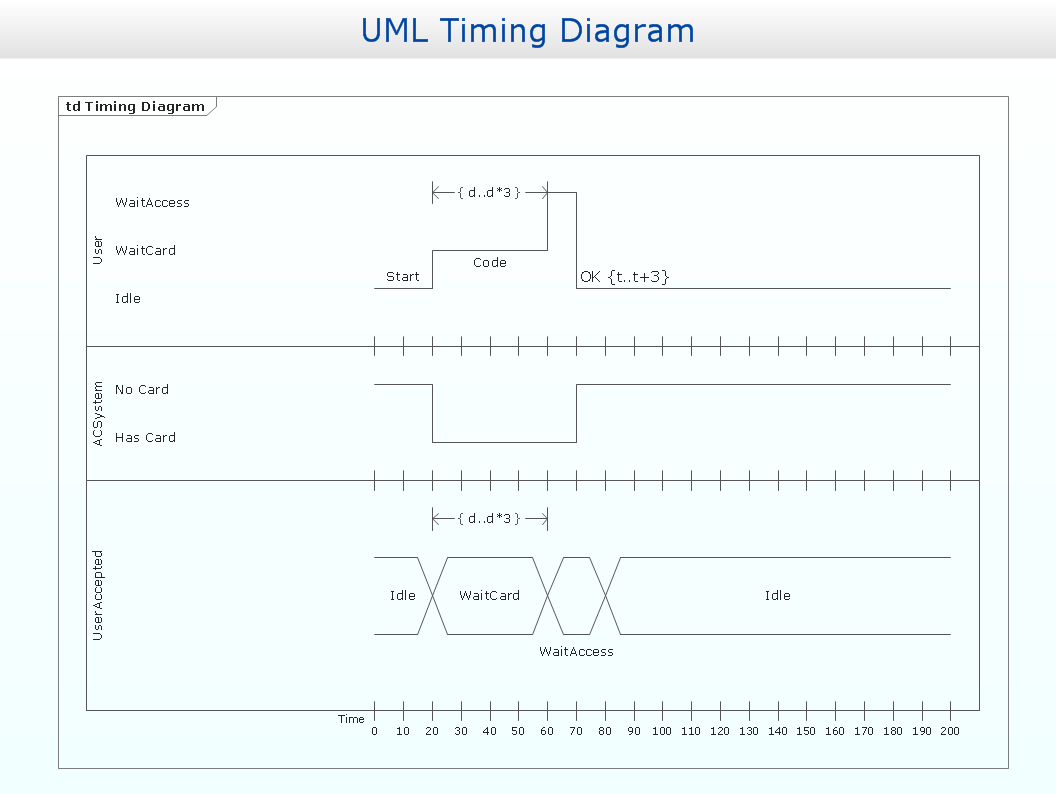
UML Timing Diagram as special form of a sequence diagram is used to explore the behaviours of objects throughout a given period of time.
 Divided Bar Diagrams
The Divided Bar Diagrams Solution extends the capabilities of ConceptDraw PRO v10 with templates, samples, and a library of vector stencils for drawing high impact and professional Divided Bar Diagrams and Graphs, Bar Diagram Math, and Stacked Graph.
Rail transport - Design elements
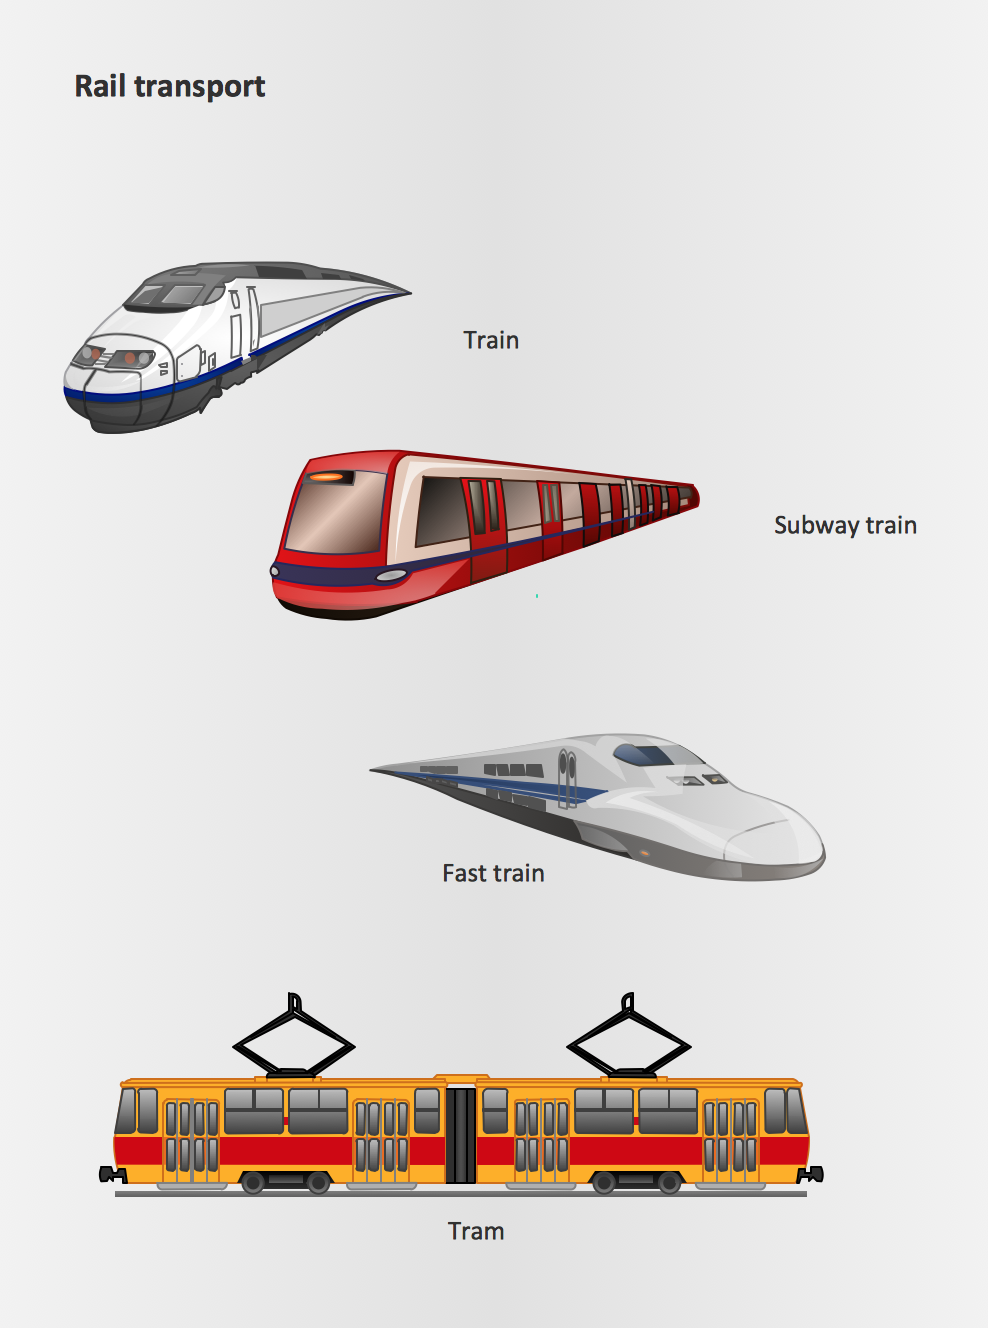
The vector stencils library Rail transport contains clipart of railway transport for ConceptDraw PRO diagramming and vector drawing software. Use it to draw illustrations of trains and transportation of passengers and goods by railroads.- Class Diagram Of Transportation Management System
- UML Class Diagram Example for Transport System | PM Personal ...
- Class Diagram For Transport Management System Project
- Class Diagram Of Transport Magement System Project In Pdf
- Class Diagram Of Online Transport Management
- UML Class Diagram Example for Transport System | Data Flow ...
- UML Class Diagram Example for Transport System
- Enterprise Architecture Diagrams | UML Class Diagram ...
- UML Class Diagram Example for Transport System | Rapid UML ...
- Transport Management System Class Diagram
- Class Diagram For Transportation Management System
- UML Class Diagram Example for Transport System | Fishbone ...
- Class Diagram Of Goods Transport Management System
- Transportation Management System Flow Chart
- Pdf Of Dfds Diagram For Transport Management System
- UML Class Diagram Example for GoodsTransportation System ...
- UML Class Diagram Example for Transport System | JSD - Jackson ...
- Entity-Relationship Diagram (ERD) | UML Class Diagram Example ...
- Sequence Diagram For Transportation Management


