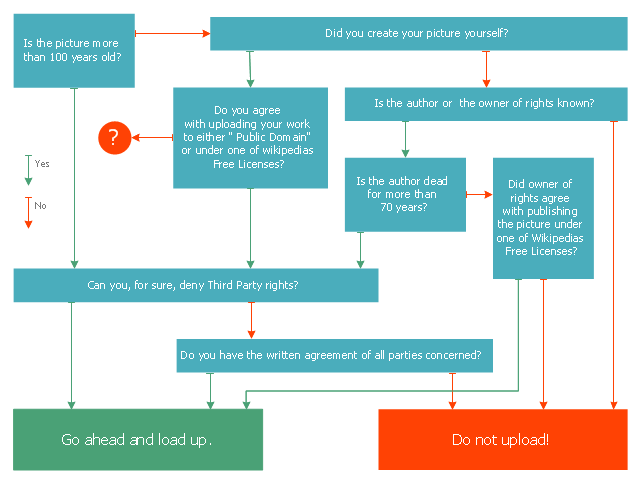
"A decision tree is a decision support tool that uses a tree-like graph or model of decisions and their possible consequences, including chance event outcomes, resource costs, and utility. It is one way to display an algorithm.
Decision trees are commonly used in operations research, specifically in decision analysis, to help identify a strategy most likely to reach a goal. ...
A decision tree is a flowchart-like structure in which internal node represents test on an attribute, each branch represents outcome of test and each leaf node represents class label (decision taken after computing all attributes). A path from root to leaf represents classification rules.
In decision analysis a decision tree and the closely related influence diagram is used as a visual and analytical decision support tool, where the expected values (or expected utility) of competing alternatives are calculated.
A decision tree consists of 3 types of nodes:
(1) Decision nodes - commonly represented by squares.
(2) Chance nodes - represented by circles.
(3) End nodes - represented by triangles.
Decision trees are commonly used in operations research, specifically in decision analysis, to help identify a strategy most likely to reach a goal." [Decision tree. Wikipedia]
This marketing diagram sample was redesigned from the Wikimedia Commons file: Decision Tree on Uploading Imagesv2.svg.
[commons.wikimedia.org/ wiki/ File:Decision_ Tree_ on_ Uploading_ Imagesv2.svg]
The marketing diagram example "Decision tree" was created using the ConceptDraw PRO diagramming and vector drawing software extended with the Marketing Diagrams solution from the Marketing area of ConceptDraw Solution Park.
www.conceptdraw.com/ solution-park/ marketing-diagrams
 Marketing Diagrams
This solution extends ConceptDraw PRO with samples, templates and library of design elements for drawing the marketing diagrams.
MS Visio Look a Like Diagrams
No need for any special drawing skills to create professional looking diagrams outside of your knowledge base. ConceptDraw PRO takes care of the technical details, allowing you to focus on your job, not the drawing. ConceptDraw PRO delivers full-functioned alternative to MS Visio. ConceptDraw PRO supports import of Visio files. ConceptDraw PRO supports flowcharting, swimlane, orgchart, project chart, mind map, decision tree, cause and effect, charts and graphs, and many other diagram types.How to Draw Business Process Diagrams with RapidDraw Interface
Business Process Modeling Notation (BPMN) is a set of standard symbols that allow you to create a graphical view of a business process. The symbols were developed to help users develop standard, unified structure of processes, and any messages shared between these processes.- Decision tree diagram
- Decision tree diagram | Marketing Diagrams | How To Create Root ...
- Decision tree diagram | Influence Diagram | MS Visio Look a Like ...
- Decision Tree Templates For Free
- Types of Welding in Flowchart | Decision tree diagram | Computer ...
- Decision Tree Example
- Example Decision Tree Diagram Software
- Decision Tree Template Visio
- Influence Diagram Software | Decision Making | Cross-Functional ...
- Decision Tree Template
- Decision tree diagram | Marketing Diagrams | Influence Diagram ...
- Decision Tree Diagram For Online Shopping Managment System
- Decision Tree Maker
- Online Decision Tree Maker
- Root cause analysis tree diagram - Template | PROBLEM ...
- Decision Making | Block diagram - Customer decision making ...
- Decision Tree Algorithm Flowchart And Sequence Daigram
- Decision Tree Diagram For Online Shopping System
- Block Diagrams | Decision Tree For Online Shopping System
- Creating A Decision Tree


