Mind Mapping in the Quality Management
ConceptDraw MINDMAP has a addition to the ConceptDraw Solution Park that provides a creative approach to visualizing quality processes, Quality Mind Map Solution.Fundamental Tool in Quality Management
ConceptDraw MINDMAP is a fundamental tool in quality management to describe visual instructions on any process.Mind Map - Quality Structure
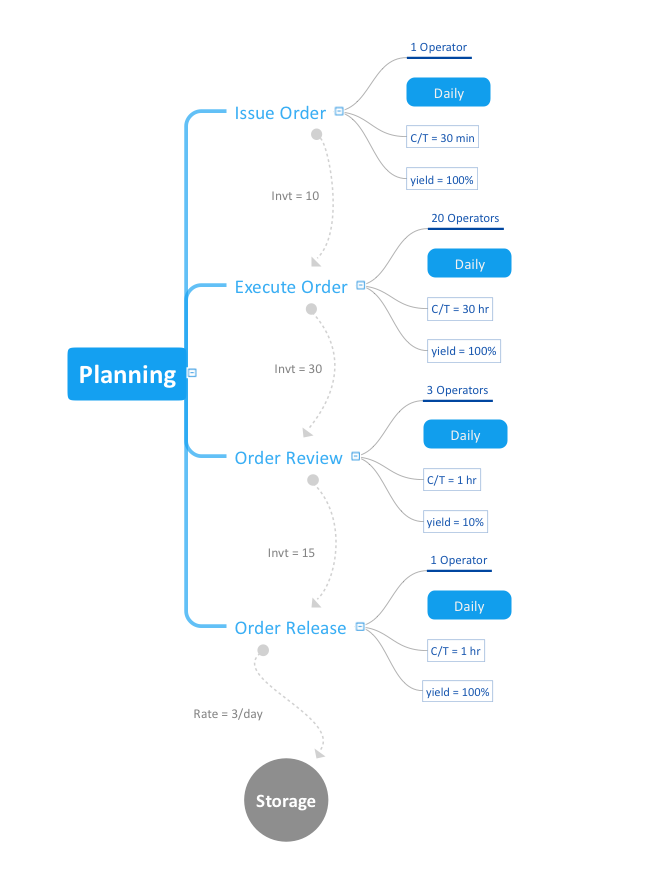
ConceptDraw MINDMAP is a good way to describe visual instructions on any quality process.Quality Control
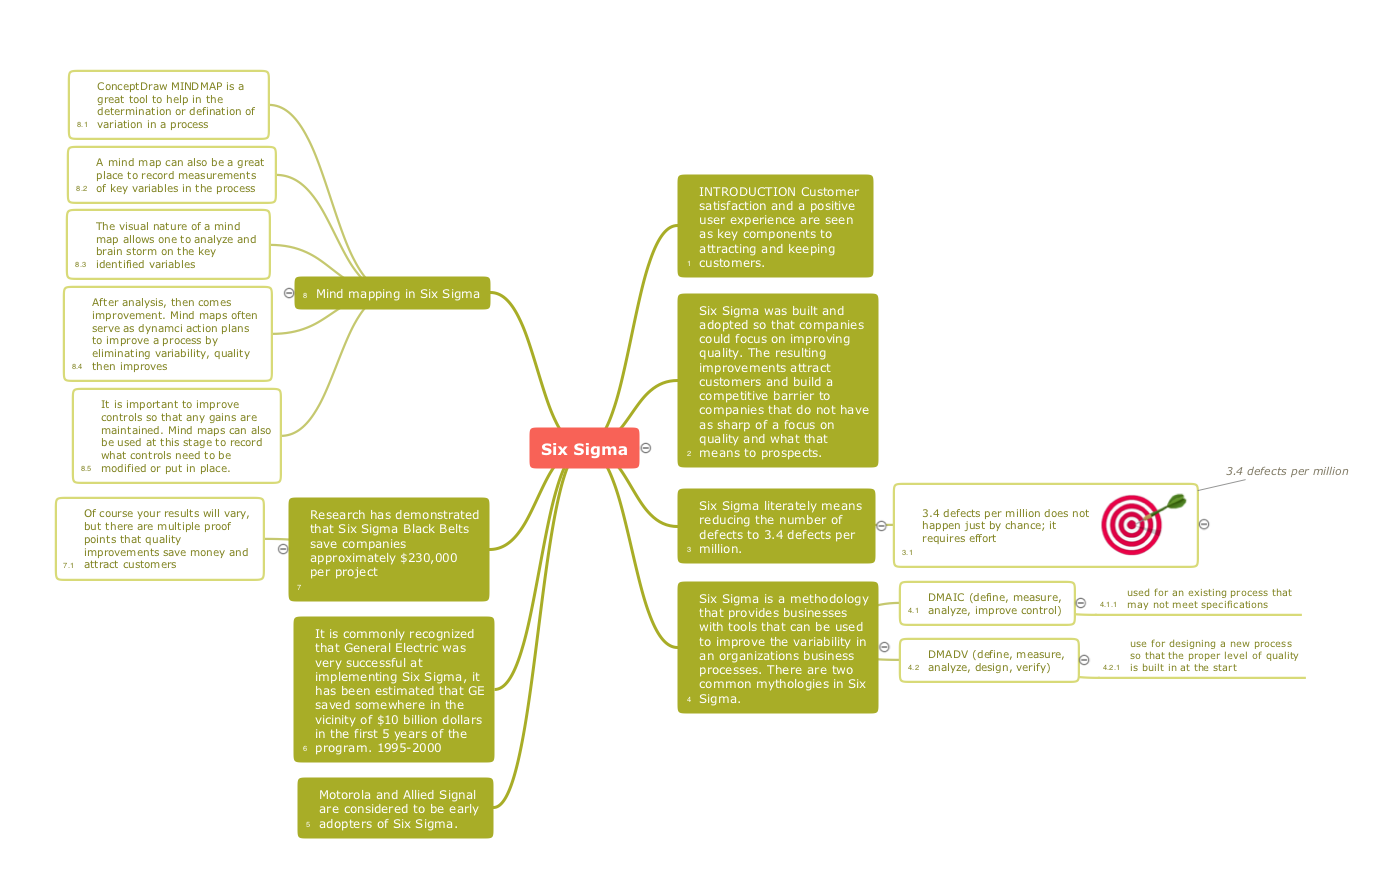
Using mind mapping for quality management is a creative approach that allows one to structure all key quality points on the one page.The best Quality Mind Maps software
ConceptDraw MindMap is the best Quality mind mapping software. It lets you easily identify the critical points during a conference call.Quality Criteria MindMap
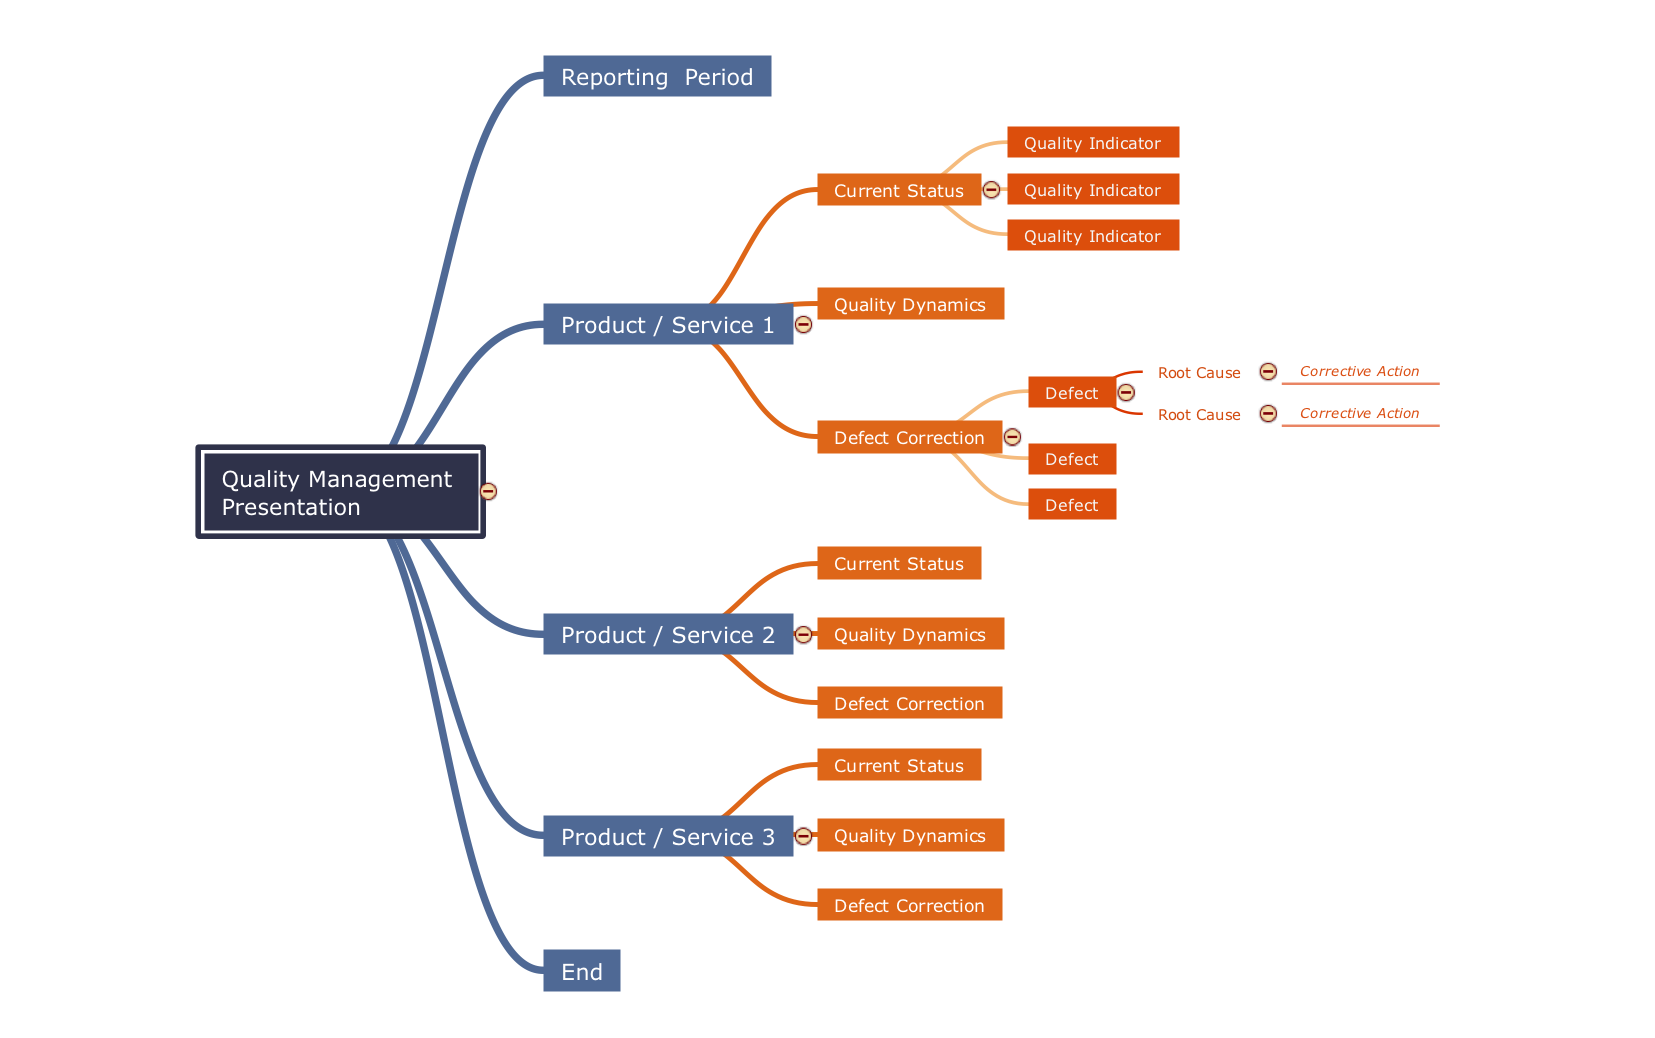
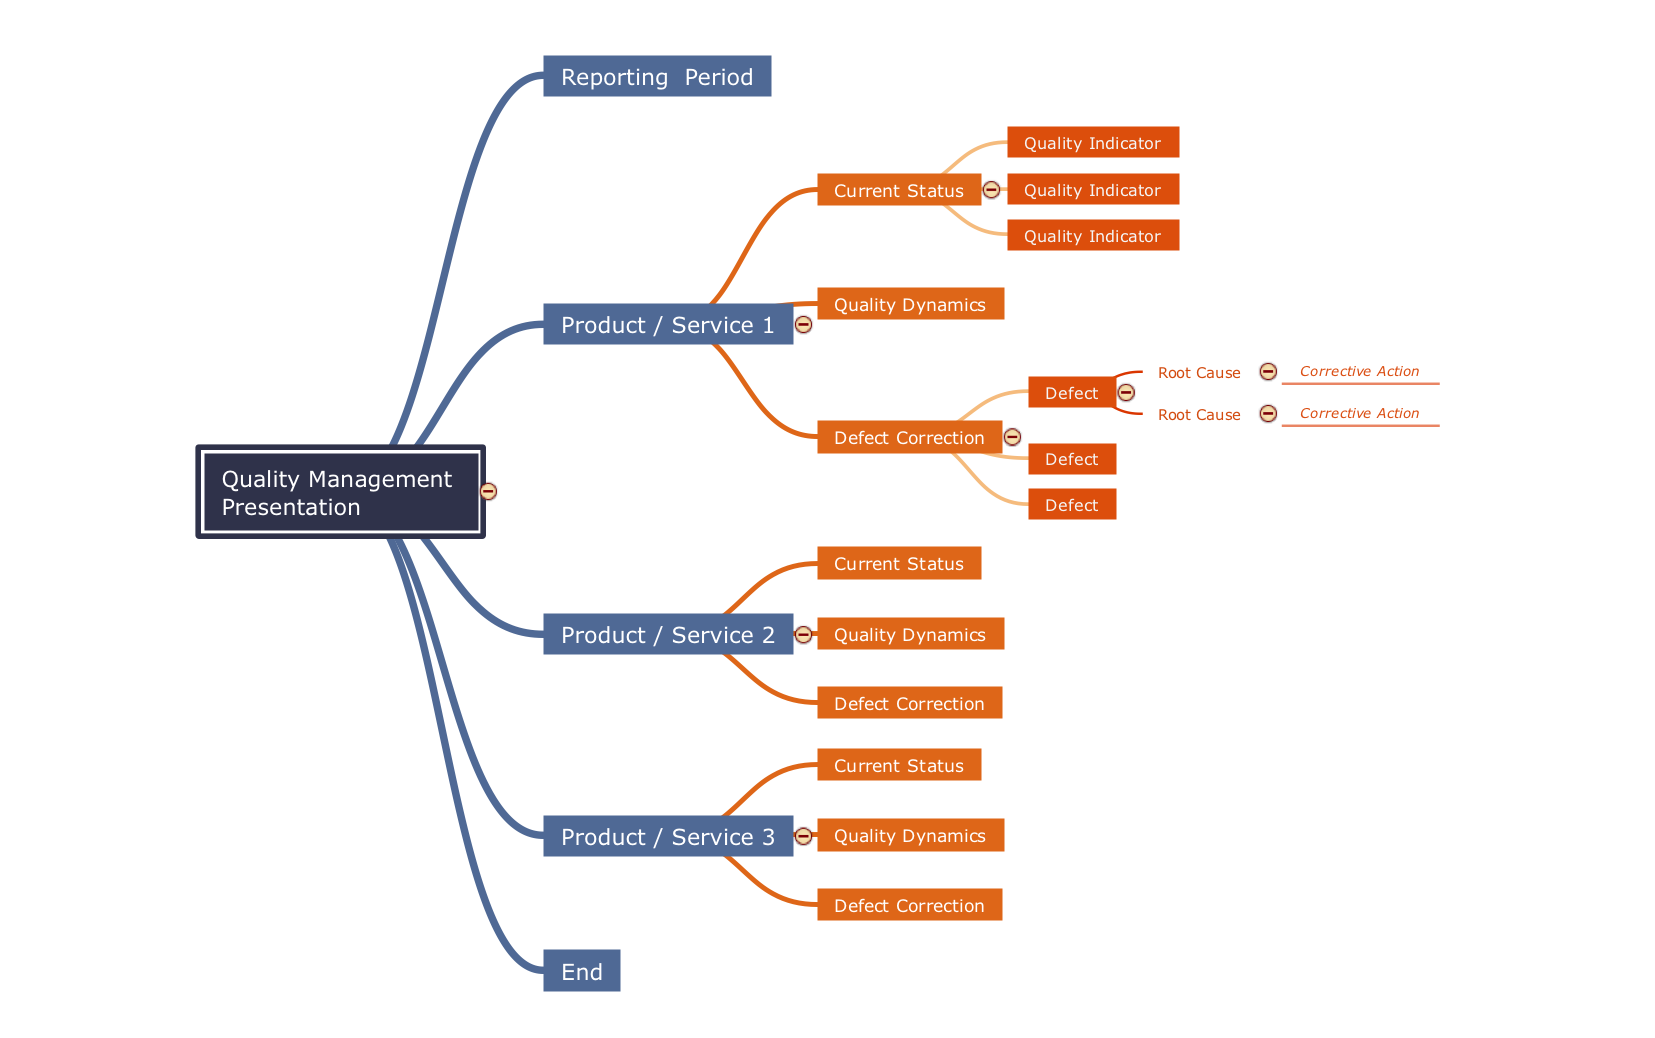
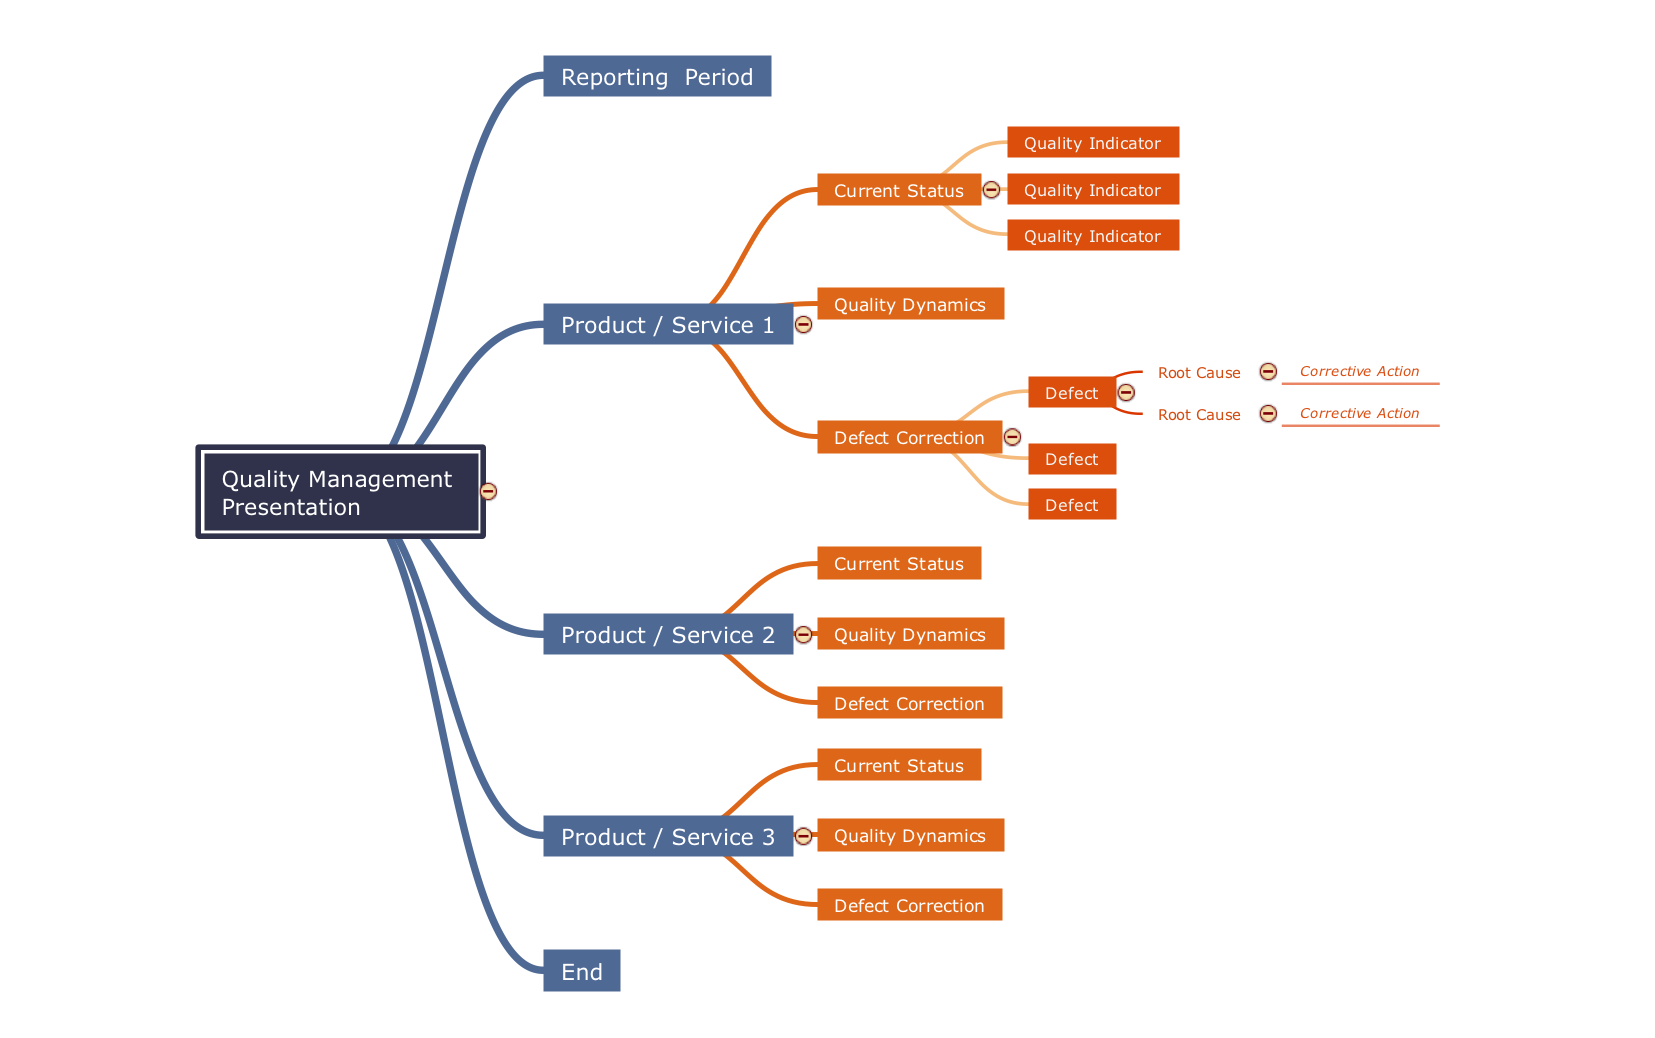
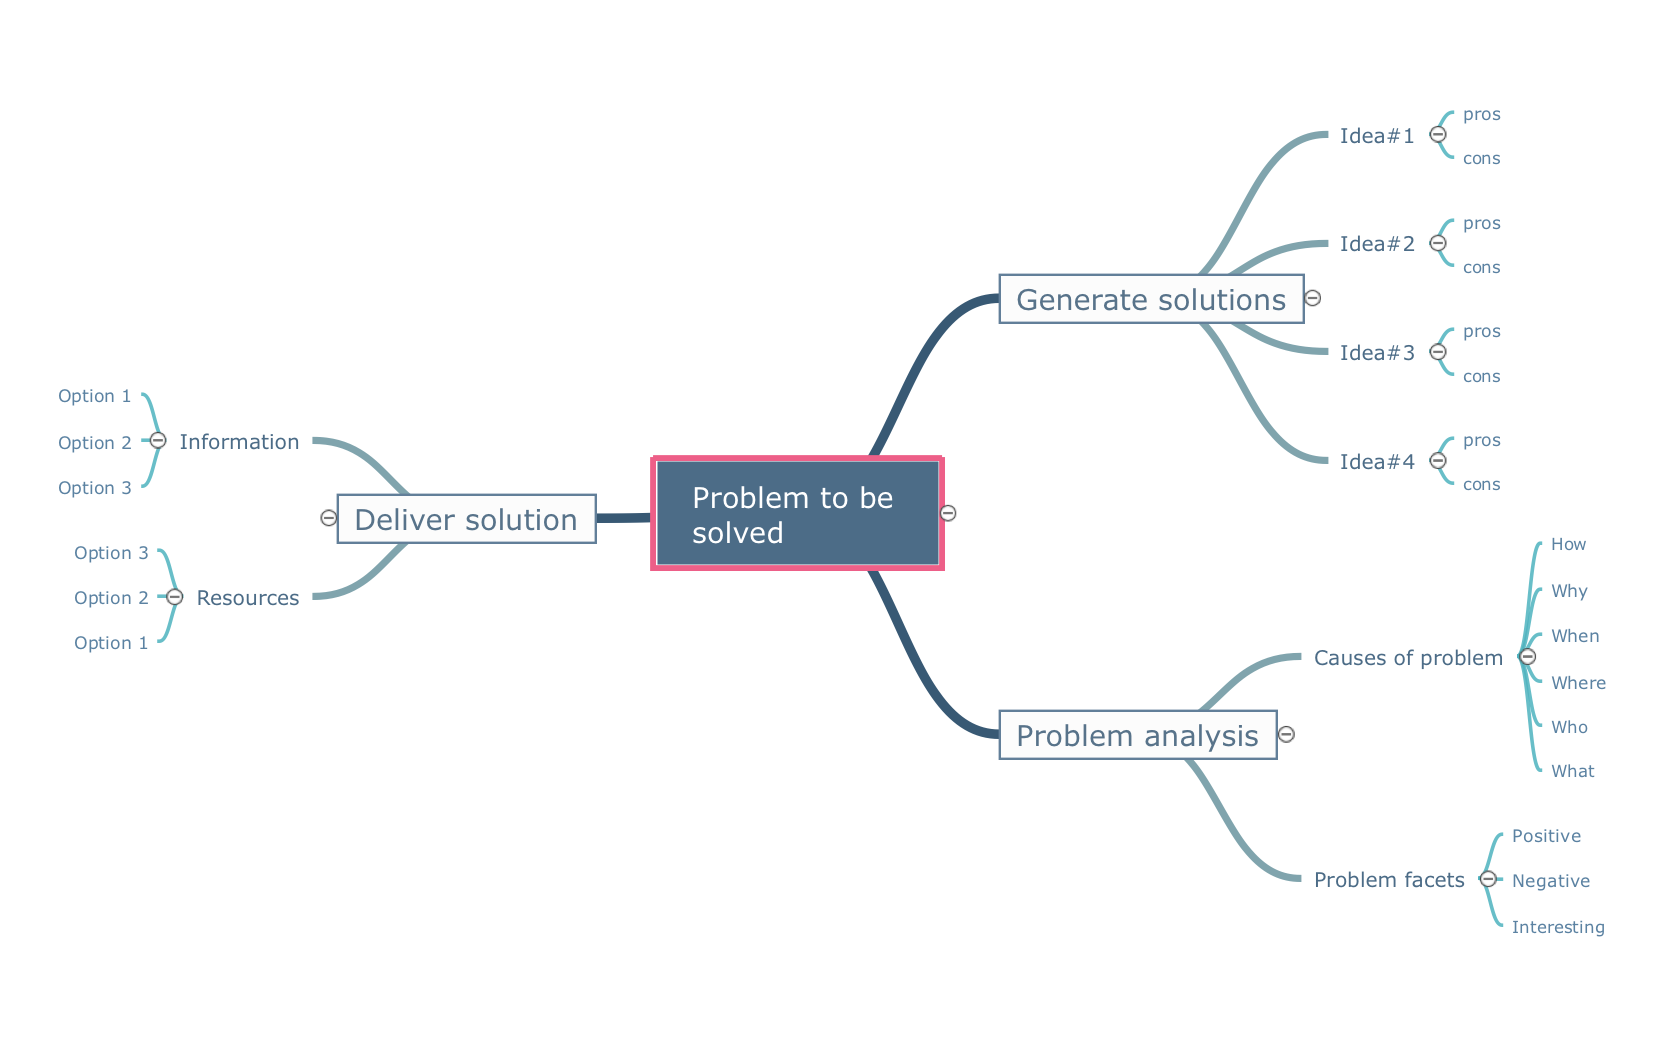
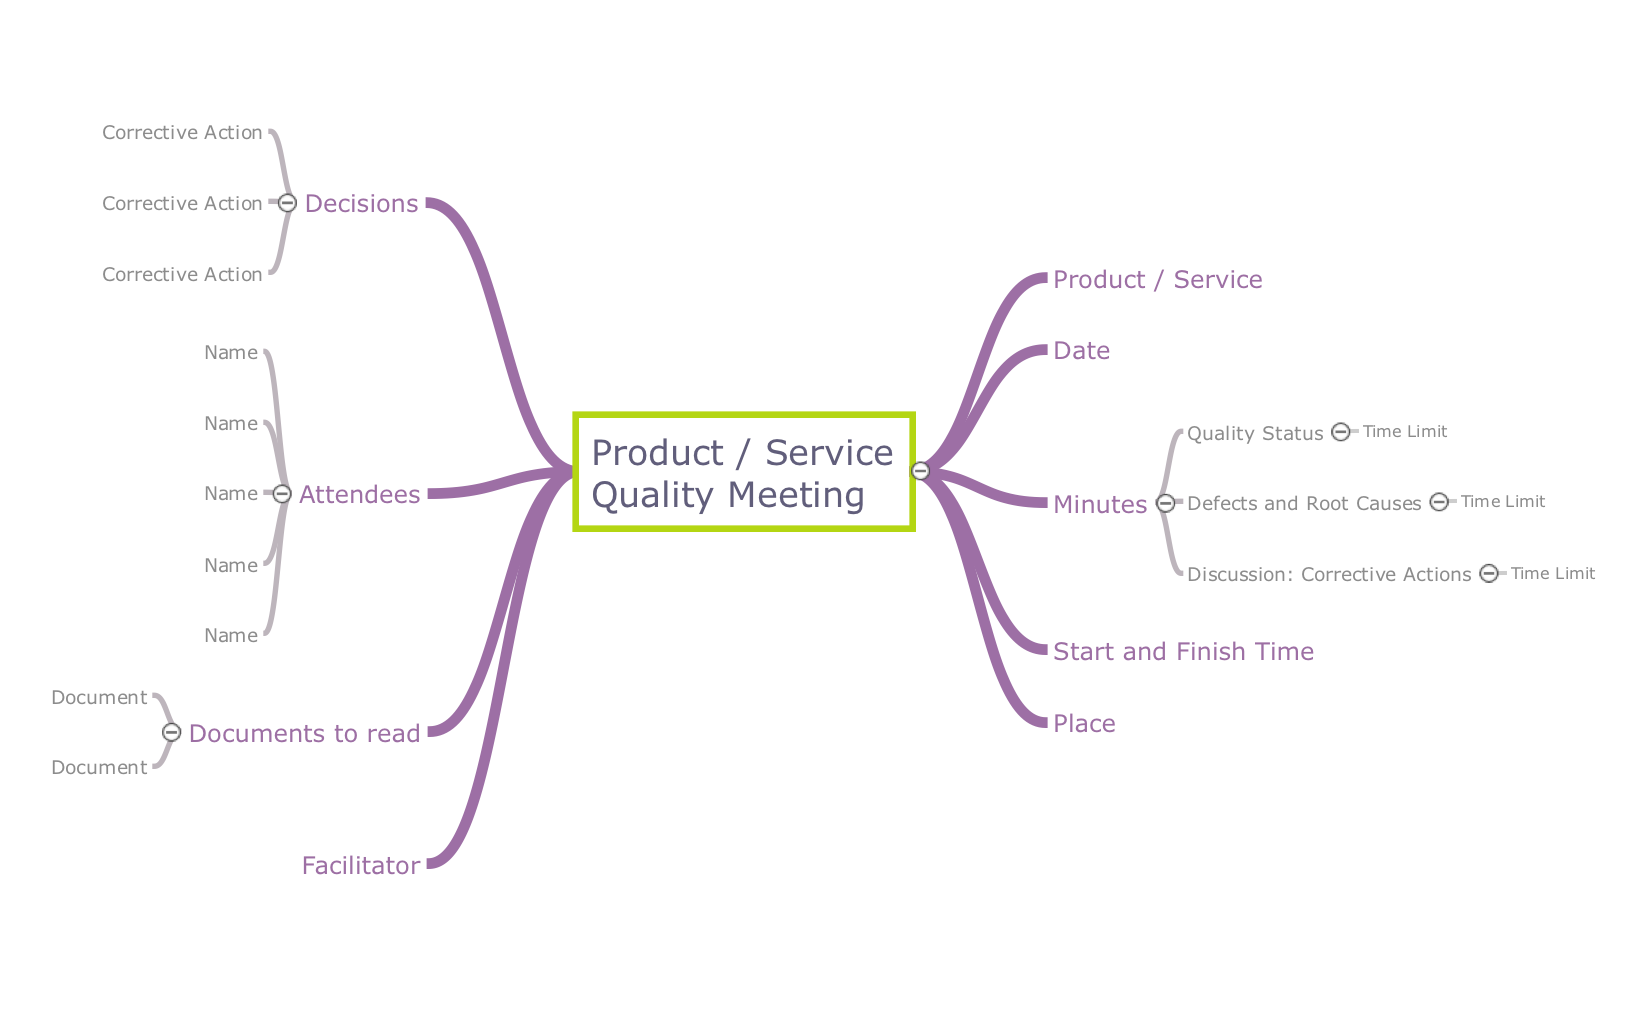
Quality Management Mind Maps - Presentations, Meeting Agendas, Problem will be solved. The visual form of mind maps is helpful in all stages of quality management, from describing problem to describing and documenting a decision.Quality Mind Maps - samples and templates
Use samples and templates to describe your own quality processes, brainstorm, and structure quality issues.Best Value — Total Quality Management
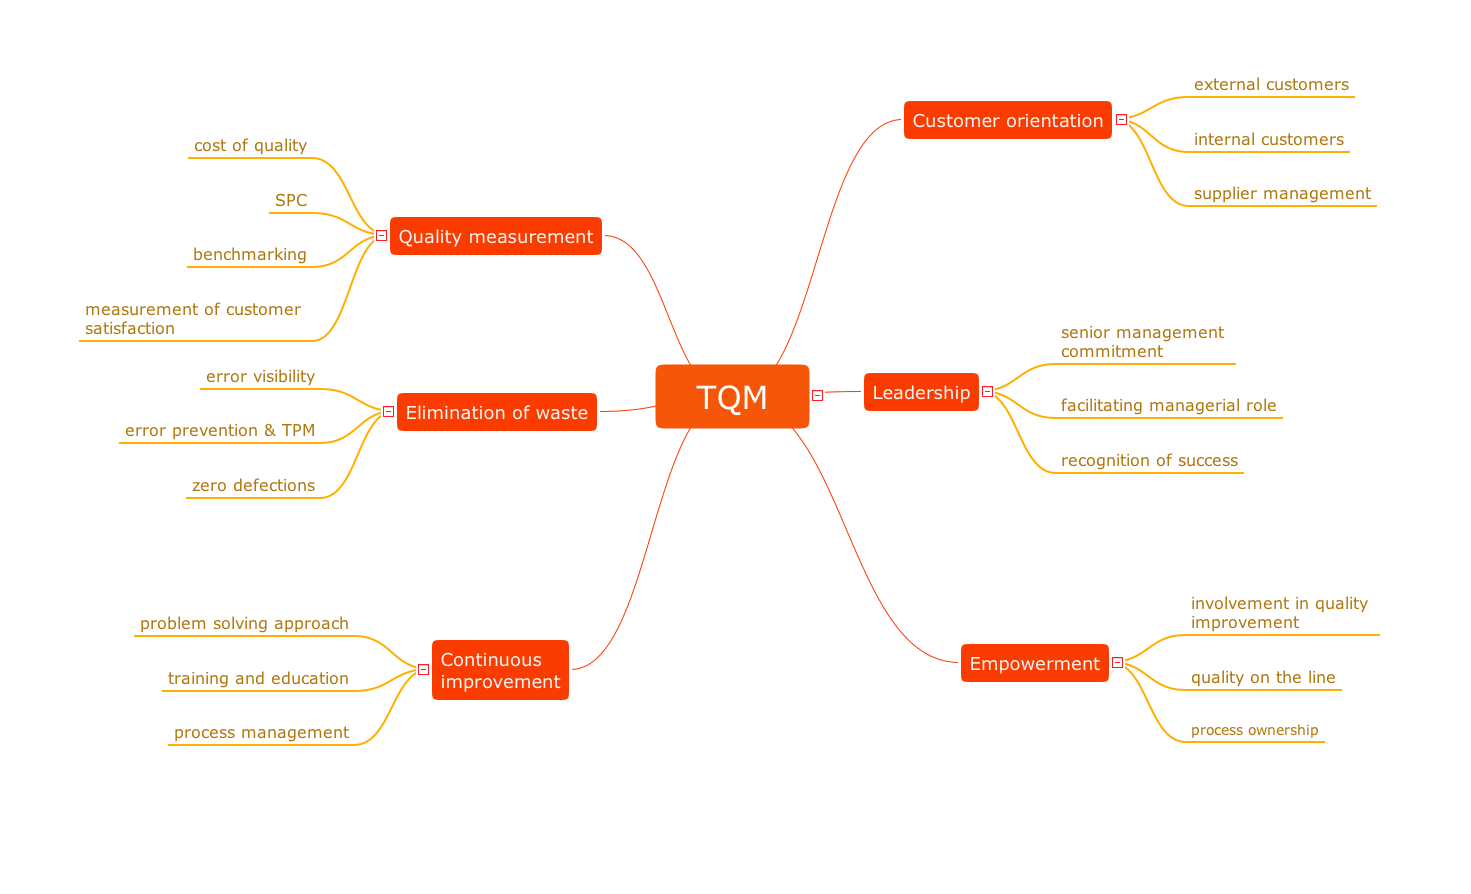
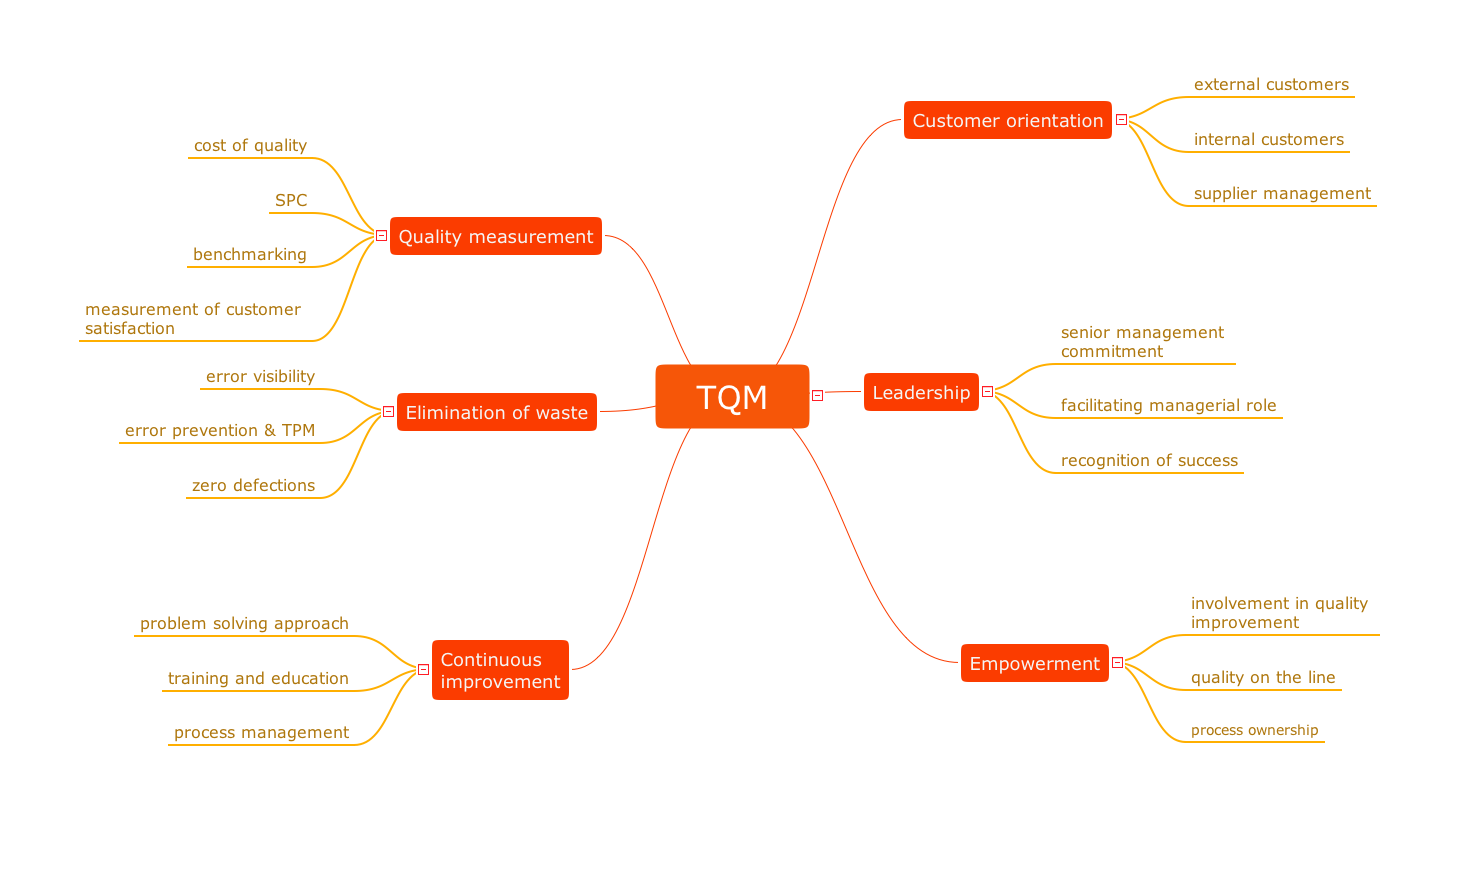
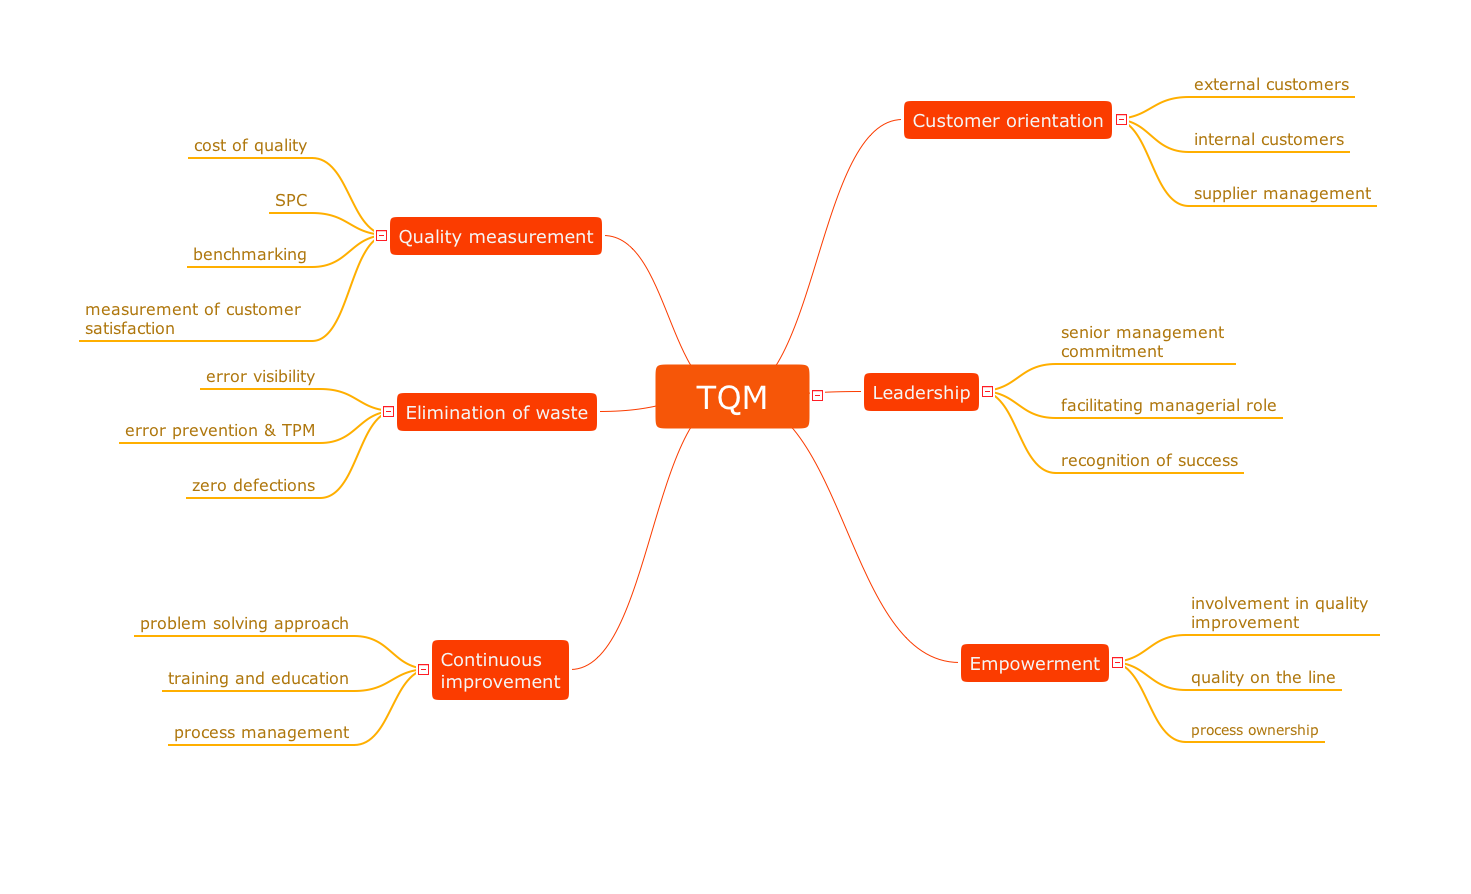
The Total Quality Management Diagram solution helps your organization visualize business and industrial processes. Create Total Quality Management diagrams for business process with ConceptDraw software.Quality Management Teams
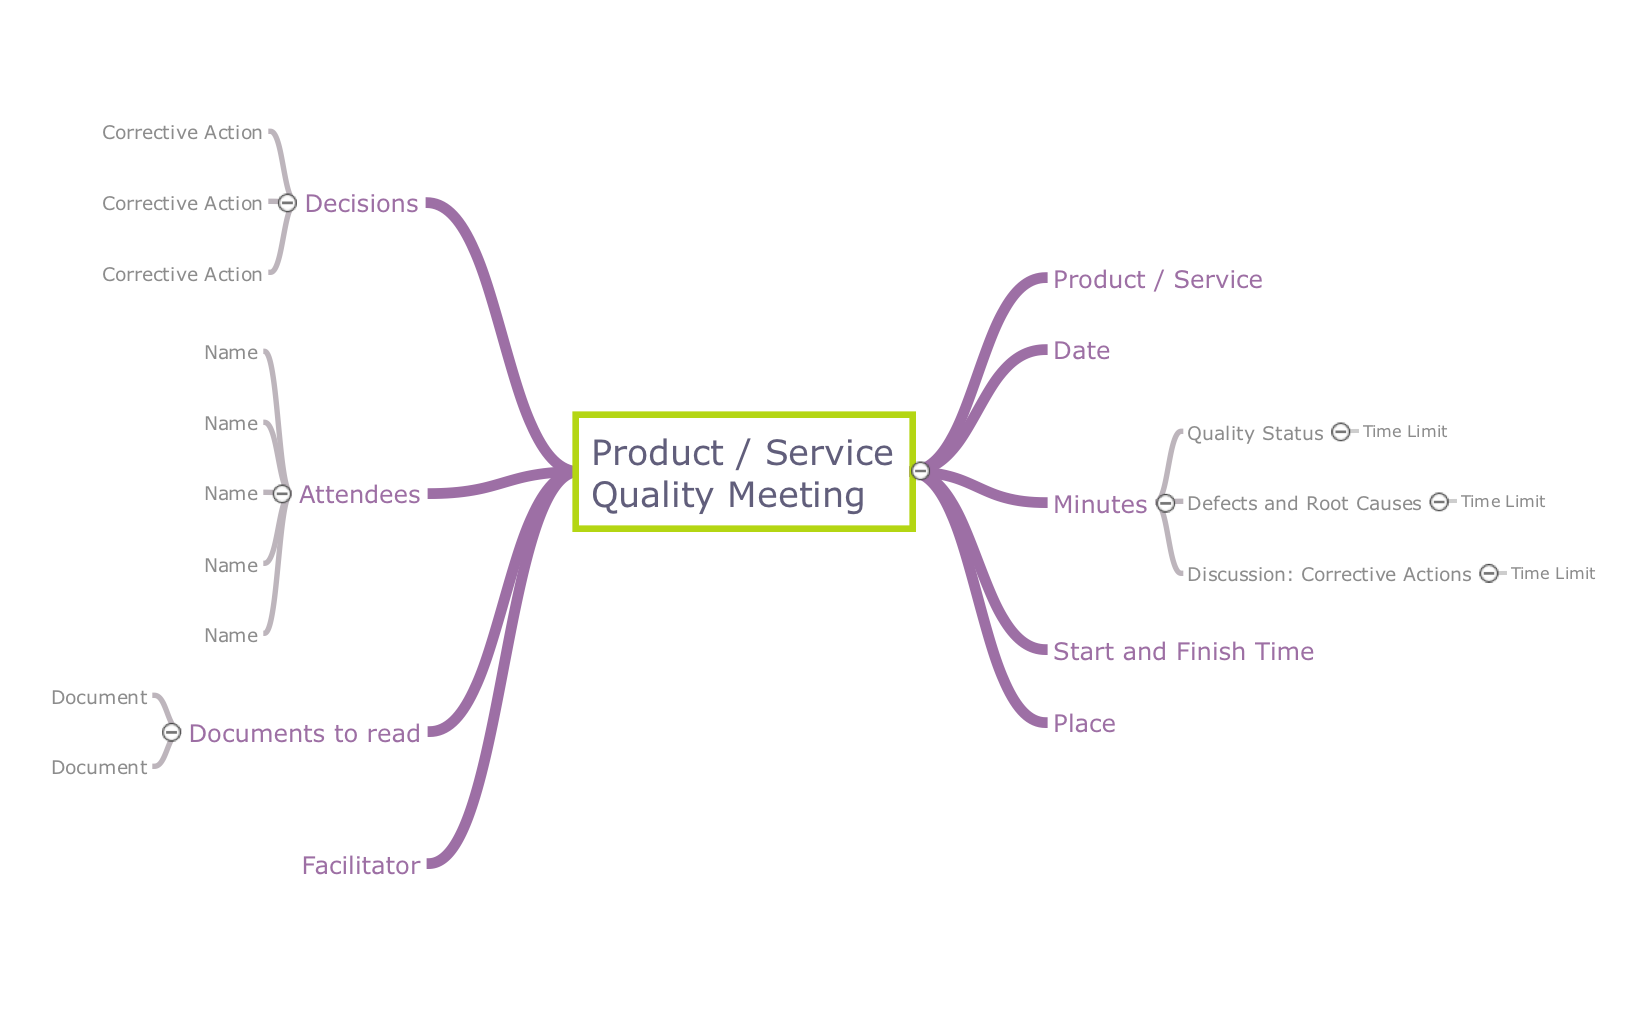
ConceptDraw MINDMAP with Quality mindmaps solution as a demonstration of the creative approach to quality management in daily work of quality management team.What is a Quality Management
Successful quality management implemented in a company of any size is a critical component of a company organization.It helps to bring out the best in your products and services
Using ConceptDraw you can describe your own quality processes, brainstorm, and structure quality issues.Identifying Quality Management System
The Total Quality Management Diagram solution helps your organization visualize business and industrial processes. Create Total Quality Management diagrams for business process with ConceptDraw software.What is a Quality Management
Successful quality management implemented in a company of any size is a critical component of a company organization.Quality issues in heir organization
ConceptDraw Quality MindMap solution is a perfect additional tool for the quality team of your organization.Quality visualization in your company
Using ConceptDraw quality mind maps is a perfect addition to quality visualization in your company.Total Quality Management Business Diagram
The Total Quality Management Diagram solution helps you and your organization visualize business and industrial processes. Create Total Quality Management diagrams for business process with ConceptDraw software.Why do you need the quality management for the organization
You can describe your own quality processes, brainstorm, and structure quality issues; then you can easily and quickly present it to your team. Quality Management Mind Maps - Presentations, Meeting Agendas, Problem will be solved.Definition TQM Diagram
The Total Quality Management Diagram solution helps your organization visualize business and industrial processes. Create Total Quality Management diagrams for business process with ConceptDraw software.
 Seven Basic Tools of Quality
Manage quality control in the workplace, using fishbone diagrams, flowcharts, Pareto charts and histograms, provided by the Seven Basic Tools of Quality solution.
Quality Control Chart Software — ISO Flowcharting
Quality Control Chart Software (ISO Flowcharting) - ConceptDraw DIAGRAM extended with Total Quality Management TQM Diagrams Solution from the Quality Management Area is the best diagramming and vector drawing software that allows you to draw the quality control charts quick and easy. The quality control chart is a graphic that illustrates the accordance of processes or products to the intended specifications and degree of differences from them. Depending on what type of data you need analyze, there are used different types of quality control charts: X-bar charts, S charts, Np charts.- Organizational Structure Total Quality Management | TQM Diagram ...
- Difference Between Process And Subprocess In Visio
- Process Flowchart | TQM Diagram Example | TQM Diagram ...
- Process Flowchart | Best Value Stream Mapping mac Software ...
- Process Flowchart | TQM Diagram Example | Definition TQM ...
- Process Flowchart | Basic Flowchart Symbols and Meaning ...
- Definition TQM Diagram | TQM Diagram Example | Organizational ...
- Process Flowchart | Quality Control Chart Software — ISO ...
- Difference Between Workflow And Flowchart
- Probability Quality Control Tools | Identifying Quality Management ...
- Total Quality Management Definition | Process Flowchart | Block ...
- Cross Functional Flowchart Symbols | Best Flowchart Software and ...
- Organizational Structure Total Quality Management | Quality issues ...
- HR management process - Flowchart | Types of Flowchart ...
- TQM Software — Build Professional TQM Diagrams | Total Quality ...
- Quality Control Chart Software — ISO Flowcharting | Create TQM ...
- Probability Quality Control Tools | Process Flowchart | Identifying ...
- Best Mind Mapping Program for Making Presentations | Quality Mind ...
- Total Quality Management TQM Diagrams | Seven Management and ...

