Typography Infographic Software

Typography Infographic Examples

Typography Graphic

Infographic Generator

Typography Art

How to Create an Infographic

Typography Font

HelpDesk
How to Create a Typography Infographic Using ConceptDraw PRO

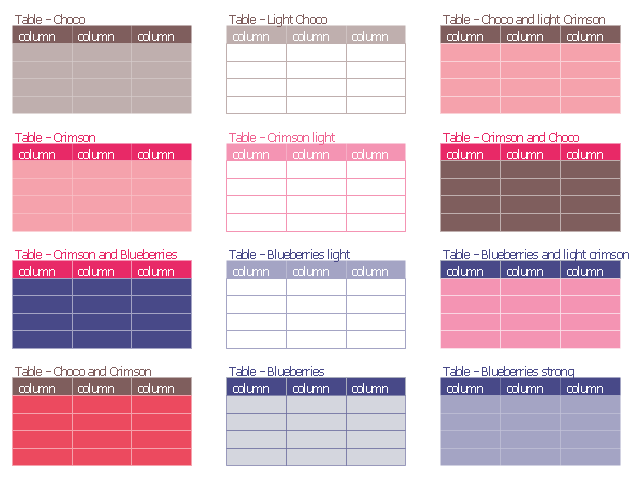
The vector stencils library "Tables" contains 12 table blocks. Use it to add typography elements into your infographics.
"A table is a means of arranging data in rows and columns. The use of tables is pervasive throughout all communication, research and data analysis. Tables appear in print media, handwritten notes, computer software, architectural ornamentation, traffic signs and many other places. The precise conventions and terminology for describing tables varies depending on the context. Further, tables differ significantly in variety, structure, flexibility, notation, representation and use. In books and technical articles, tables are typically presented apart from the main text in numbered and captioned floating blocks." [Table (information). Wikipedia]
The example "Design elements - Tables" was created using the ConceptDraw PRO diagramming and vector drawing software extended with the Typography Infographics solition from the area "What is infographics" in ConceptDraw Solution Park.
Typography infographics elements - Tables
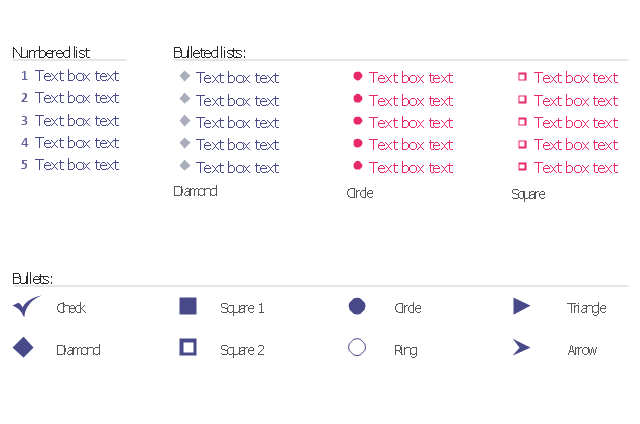
The vector stencils library "Bulleted and numbered lists" contains 12 elements of bulleted and numbered lists, and bullets for creating typography infographics.
"In typography, a bullet ( • ) is a typographical symbol or glyph used to introduce items in a list. ... The bullet symbol may take any of a variety of shapes, such as circular, square, diamond, arrow, etc., and typical word processor software offer a wide selection of shapes and colours. Several regular symbols are conventionally used in ASCII-only text or another environments where bullet characters are not available, such as * (asterisk), - (hyphen), . (period), and even o (lowercase O). Of course, when writing by hand, bullets may be drawn in any style. Historically, the index symbol was popular for similar uses." [Bullet (typography). Wikipedia]
The example "Design elements - Bulleted and numbered lists" was created using the ConceptDraw PRO diagramming and vector drawing software extended with the Typography Infographics solition from the area "What is infographics" in ConceptDraw Solution Park.
Typography infographics elements - Bulleted and numbered lists
Infographic Software

Infographic Tools

How to Make an Infographic

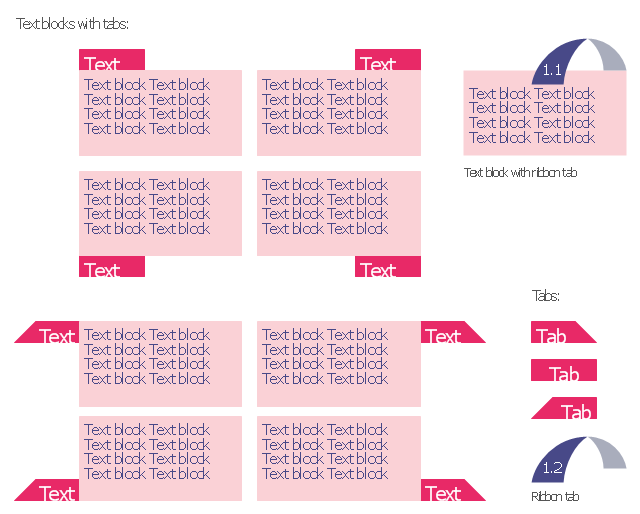
The vector stencils library "Tabbed text blocks" contains 13 tabs and tabbed text blocks. Use it to add typography elements into your infographics.
"In interface design, a tabbed document interface (TDI) or Tab is a graphical control element that allows multiple documents or panels to be contained within a single window, using tabs as a navigational widget for switching between sets of documents. It is an interface style most commonly associated with web browsers, web applications, text editors, and preference panes.
GUI tabs are modeled after traditional card tabs inserted in paper files or card indexes (in keeping with the desktop metaphor)." [Tab (GUI). Wikipedia]
The example "Tabbed text blocks" was created using the ConceptDraw PRO diagramming and vector drawing software extended with the Typography Infographics solition from the area "What is infographics" in ConceptDraw Solution Park.
Typography infographics elements - Tabbed text blocks
Internet Marketing Infographic

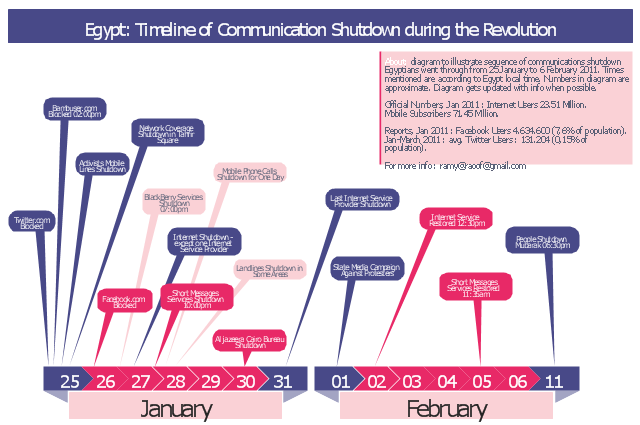
This typography infographics example was redesigned from the Wikimedia Commons file: Egypt timeline of communication shutdown during jan25revolution.jpg. [commons.wikimedia.org/ wiki/ File:Egypt_ timeline_ of_ communication_ shutdown_ during_ jan25revolution.jpg]
This file is licensed under the Creative Commons Attribution 3.0 Unported license. [creativecommons.org/ licenses/ by/ 3.0/ deed.en]
Diagram to illustrate sequence of communications shutdown Egyptians went through from 25 January to 06 February 2011. Times mentioned are according to Egypt local time. Numbers in the diagram are approximate. Last update of the diagram October 2011.
"2011 Internet shutdown.
Diagram to illustrate sequence of communications shutdown Egyptians went through from 25 January to 06 February 2011. Times mentioned are according to Egypt local time. Numbers in the diagram are approximate. Last update of the diagram October 2011.
The 2011 Egyptian protests began on 25 January 2011. As a result, on January 25 and 26, the government blocked Twitter in Egypt and later Facebook was blocked as well.
On January 27, various reports claimed that access to the Internet in the entire country had been shut down. ...
On February 2, connectivity was re-established by the four main Egyptian service providers. A week later, the heavy filtering that occurred at the height of the revolution had ended and bloggers and online activists who had been arrested were released." [Internet in Egypt. Wikipedia]
The example "Egypt timeline of communication shutdown during jan 25 revolution" was created using the ConceptDraw PRO diagramming and vector drawing software extended with the Typography Infographics solition from the area "What is infographics" in ConceptDraw Solution Park.
Infographics
Marketing Plan Infographic

Marketing Infographics

- Typography Infographic Software | Typography Infographic ...
- Typography Graphic | Typography Infographic Software ...
- How to Create a Typography Infographic Using ConceptDraw PRO ...
- Typography Infographic Examples | Typography Art | Typography ...
- Typography Infographic Software | ConceptDraw Solution Park ...
- Typography Infographic Software | ABC - Vector stencils library ...
- Typography Graphic | How to Create a Typography Infographic ...
- Typography Art | How to Create a Typography Infographic Using ...
- Typography Font | How to Create a Typography Infographic Using ...
- Superb Examples of Infographic Maps | Typography Infographic ...
- Typography Infographic Examples | Excellent Examples of ...
- Typography Graphic | Typography Art | Typography Font ...
- Typography Art | Typography Graphic | Typography Font | Typography
- Mac OS X Lion user interface - Vector stencils library | Typography ...
- How to Create an Infographic | ConceptDraw Solution Park ...
- Infographic Tools | ConceptDraw Solution Park | Best Tool for ...
- How to Create Infographics Using the Spatial Infographics Solution ...
- Presentations in Educational Process | Basketball Plays Software ...
- How To Create a MS Visio Data-driven Infographics Using ...
- Best Tool for Infographic Construction | Spatial infographics Design ...