 HR Dashboard
The HR Dashboard solution extends ConceptDraw DIAGRAM functionality with powerful drawing tools and great collection of comprehensive vector design elements, icons, pictograms and objects, navigation elements, live objects of HR charts, HR indicators, and thematic maps. The range of HR Dashboards applications is extensive, among them the human resource management, recruitment, hiring process, human resource development. ConceptDraw DIAGRAM software is perfect for creation HR Dashboard with any goal you need. It gives you all opportunities for designing not only informative, but also professional looking and attractive HR Dashboards of any style and degree of detalization, that are perfect for using in presentations, reports and other thematic documents.
 PM Dashboards
The PM Dashboards solution extends the management boundaries of ConceptDraw DIAGRAM and ConceptDraw PROJECT products with an ability to demonstrate changes to the budget status, to show the project progress toward its objectives, to display clearly the identified key performance indicator (KPI) or the set of key performance indicators for any project. This solution provides you with examples and ability to generate three types of visual dashboards reports based on your project data Project Dashboard, Tactical Dashboard, and Radar Chart. By dynamically charting the project’s key performance indicators that are collected on one ConceptDraw DIAGRAM document page, all project participants, project managers, team members, team leaders, stakeholders, and the entire organizations, for which this solution is intended, have access to the daily status of projects they are involved in.
 CRM Center Dashboard
The CRM Center Dashboard solution extends ConceptDraw DIAGRAM functionality with CRM software tools, large collection of CRM Charts live objects, CRM icons, CRM indicators, CRM maps and navigation elements, the set of professionally designed CRM samples and templates to help you construct your own CRM Dashboards and CRM Center Dashboards in a few minutes, to depict the current and actual data by connecting or refreshing the data source file. The customer management software ConceptDraw DIAGRAM makes you free to choose the style for your dashboard and to regulate the quantity of clipart on the diagram according to your taste.
How To Create Project Report

This example was created on the base of the Georgia DOT Performance Management Dashboard from the Georgia Department of Transportation website.
[dot.ga.gov/ informationcenter/ statistics/ performance/ Pages/ default.aspx]
"Performance management (PM) includes activities which ensure that goals are consistently being met in an effective and efficient manner. Performance management can focus on the performance of an organization, a department, employee, or even the processes to build a product of service, as well as many other areas.
PM is also known as a process by which organizations align their resources, systems and employees to strategic objectives and priorities.
Performance management originated as a broad term coined by Dr. Aubrey Daniels in the late 1970s to describe a technology (i.e. science imbedded in applications methods) for managing both behavior and results, two critical elements of what is known as performance. A formal definition of performance management, according to Daniels' is "a scientifically based, data-oriented management system. It consists of three primary elements-measurement, feedback and positive reinforcement."" [Performance management. Wikipedia]
The meter dashboard example "Georgia DOT Performance Management" was created using the ConceptDraw PRO diagramming and vector drawing software extended with the Meter Dashboard solution from the area "What is a Dashboard" of ConceptDraw Solution Park.
Meter dashboard

Tactical Dashboard

 Business Management Package
Business Management Package is a large set of graphical solutions from the ConceptDraw Solution Park. They are selected to help in solving the business, management, marketing and quality tasks in a best way. It is useful for many management specialists, marketing experts, business specialists, international business experts, IT managers, specialists in managing the business processes, financial specialists, and other business related specialists. Create documents, reports, statistical summaries, describe business processes, build business models for many fields including finance, education, logistic, landscape design, health, cooking, and many more.
 Logistic Dashboard
The powerful tools of Logistic Dashboard solution and specially developed live graphic objects of logistic icons, logistic navigation elements, logistic indicators, logistic charts and logistic maps effectively assist in designing Logistic dashboards, Logistic maps, Logistic charts, diagrams and infographics. The included set of prebuilt samples and quick-start templates, demonstrates the power of ConceptDraw DIAGRAM software in logistics management, its assisting abilities in development, realization and analyzing the logistic processes, and in perfection the methods of logistics management.
Reporting Dashboard Software for Business
Customer Relationship Management

 Meter Dashboard
Meter dashboard solution extends ConceptDraw DIAGRAM software with templates, samples and vector stencils library with meter indicators for drawing visual dashboards showing quantitative data. The Meter Dashboard solution may be useful for many business owners, businessmen and other people who are involved in measuring their success by using the progressive tools.
This financila dashboard example was drawn on the base of the Enterprise dashboard from the Mecklenburg County Government website.
[charmeck.org/ mecklenburg/ county/ CountyManagersOffice/ OMB/ dashboards/ Pages/ Enterprise.aspx]
"In management information systems, a dashboard is "an easy to read, often single page, real-time user interface, showing a graphical presentation of the current status (snapshot) and historical trends of an organization’s key performance indicators to enable instantaneous and informed decisions to be made at a glance."
For example, a manufacturing dashboard may show key performance indicators related to productivity such as number of parts manufactured, or number of failed quality inspections per hour. Similarly, a human resources dashboard may show KPIs related to staff recruitment, retention and composition, for example number of open positions, or average days or cost per recruitment.
Types of dashboards.
Dashboard of Sustainability screen shot illustrating example dashboard layout.
Digital dashboards may be laid out to track the flows inherent in the business processes that they monitor. Graphically, users may see the high-level processes and then drill down into low level data. This level of detail is often buried deep within the corporate enterprise and otherwise unavailable to the senior executives.
Three main types of digital dashboard dominate the market today: stand alone software applications, web-browser based applications, and desktop applications also known as desktop widgets. The last are driven by a widget engine.
Specialized dashboards may track all corporate functions. Examples include human resources, recruiting, sales, operations, security, information technology, project management, customer relationship management and many more departmental dashboards.
Digital dashboard projects involve business units as the driver and the information technology department as the enabler. The success of digital dashboard projects often depends on the metrics that were chosen for monitoring. Key performance indicators, balanced scorecards, and sales performance figures are some of the content appropriate on business dashboards." [Dashboard (management information systems). Wikipedia]
The example "Enterprise dashboard" was created using the ConceptDraw PRO diagramming and vector drawing software extended with the Composition Dashboard solution from the area "What is a Dashboard" of ConceptDraw Solution Park.
Financial dashboard

Tactical Dashboard
 Status Dashboard
Status dashboard solution extends ConceptDraw DIAGRAM software with templates, samples and vector stencils libraries with graphic indicators for drawing the visual dashboards showing status data. The graphic Status Indicators (e.g., Alerts, Progress and Rating Indicators, and Traffic Lights) are the ones that can be always used by any ConceptDraw DIAGRAM user once taken from the mentioned solution.
HelpDesk
How To Create a CRM System Dashboard

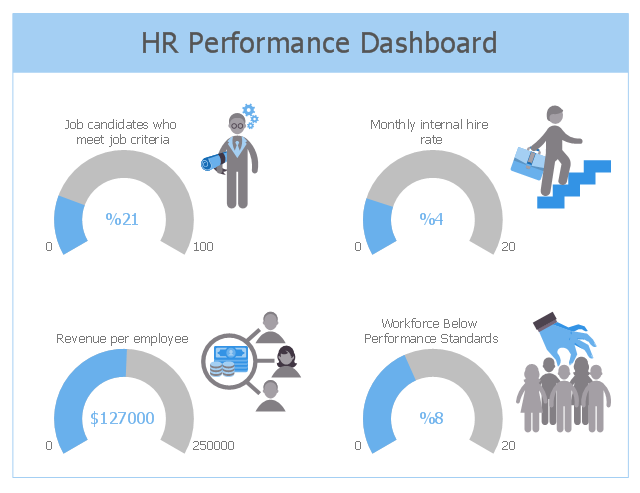
This HR dashboard sample depicts KPIs: job candidates who meet job criteria, monthly internal hire rate, revenue per employee, workforce below performance standards.
"Dashboards often provide at-a-glance views of KPIs (key performance indicators) relevant to a particular objective or business process (e.g. sales, marketing, human resources, or production).
... a human resources dashboard may show numbers related to staff recruitment, retention and composition, for example number of open positions, or average days or cost per recruitment." [Dashboard (business). Wikipedia]
The human resources dashboard example "HR Performance Dashboard" was designed using ConceptDraw PRO software extended with HR Dashboard solution from Management area of ConceptDraw Solution Park.
KPIs dashboard
"Task management is the process of managing tasks through its life cycle. It involves planning, testing, tracking and reporting. Task management can help either individuals achieve goals, or groups of individuals collaborate and share knowledge for the accomplishment of collective goals. Tasks are also differentiated by complexity, from low to high.
Effective task management requires managing all aspects of a task, including its status, priority, time, human and financial resources assignments, recurrency, notifications and so on. These can be lumped together broadly into the basic activities of task management. ...
Task management may form part of project management and process management and can serve as the foundation for efficient workflow in an organisation. Project managers adhering to task-oriented management have a detailed and up-to-date project schedule, and are usually good at directing team members and moving the project forward. ...
Task life cycle.
The status of tasks can be described by the following states:
Ready,
Assigned,
Terminated,
Expired,
Forwarded,
Finished,
Failed." [Task management. Wikipedia]
The example "Project management task status dashboard" was created using the ConceptDraw PRO diagramming and vector drawing software extended with the Status Dashboard solution from the area "What is a Dashboard" of ConceptDraw Solution Park.
Status dashboard

 Comparison Dashboard
Comparison dashboard solution extends ConceptDraw DIAGRAM software with samples, templates and vector stencils library with charts and indicators for drawing the visual dashboard comparing data. As a general rule, the Comparison Dashboard solution is used by such specialists as project managers, scientists, teachers, technicians and many other managers who care for their reputation as well as for a result of their work.
- HR Management Software | Human Resources | HR Dashboard ...
- PM Dashboards | Gant Chart in Project Management
- PM Dashboards | Project management task status dashboard
- Status Dashboard | PM Dashboards | Comparison Dashboard | Free ...
- PM Dashboards | Project management task status dashboard | How ...
- PM Dashboards | Project Management Dashboard Sample
- Status Dashboard | Project tasks dashboard | Project management ...
- A KPI Dashboard Provides the Answers Your Sales Team | Business ...
- HR Dashboard | HR Flowcharts | HR Management Software ...