HelpDesk
How to Connect a Live Object to a Text Data Source
You can easily create a visual dashboard using charts and graphics indicators from Live Objects libraries. Here is an instruction on how to connect a ConceptDraw live object with data source files in TXT format to visualize the actual values of your performance metrics.HelpDesk
How to Create a Time Series Dashboard
Time Series Dashboard means integration of some type of diagrams: Line Charts, Bar Charts, Column Charts, and Dot Plots on a single space. The ConceptDraw Time Series Dashboard solution can be used to create the interactive Time Series dashboard. The libraries of Time Series Charts solution contain the Live Objects, that can change their appearance depending on the external data. Each chart from the Time Series dashboard displays particular source data. You can include Time Series Charts in your business or technical dashboards to show and compare the items changing over time.HelpDesk
How to Create a Meter Dashboard
The Time Series Dashboard Solution can be used to create the interactive Time Series Charts as Column Charts, Line Charts, or Bar Charts for your interactive dashboard.HelpDesk
How to Use ConceptDraw Sales Dashboard Solution
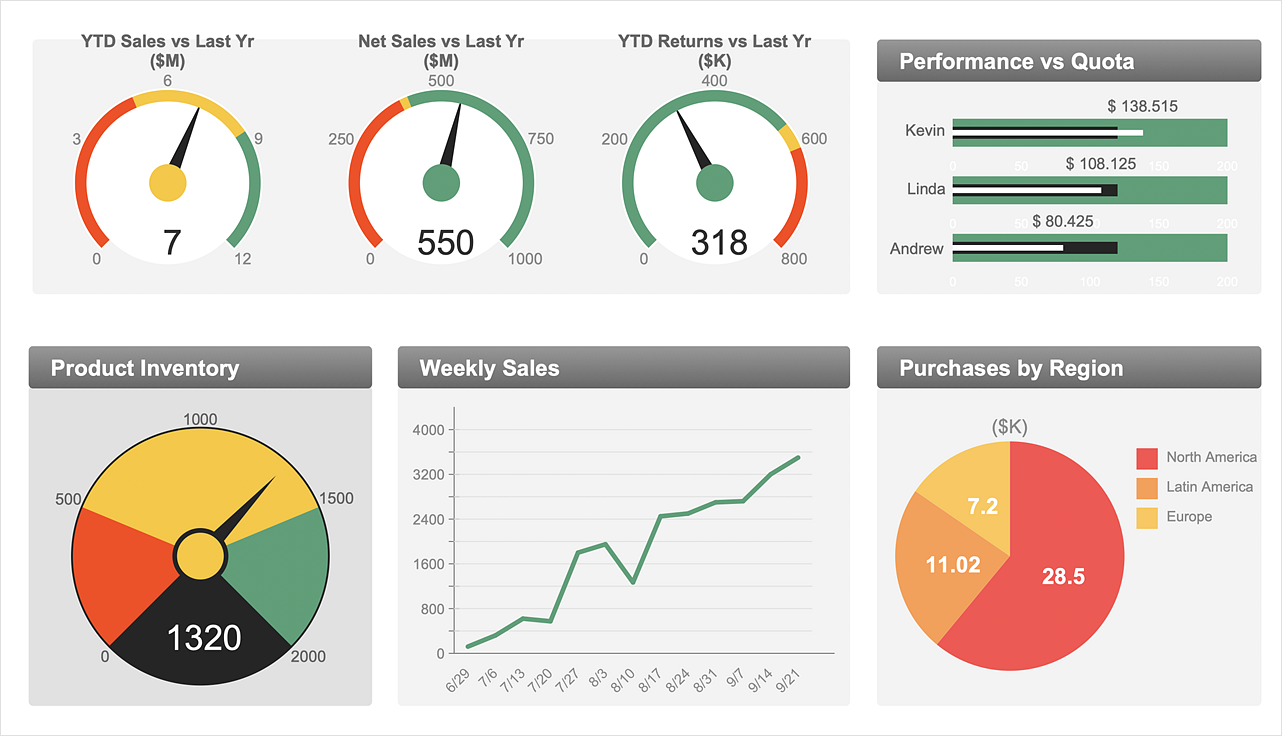
An interactive visual dashboard is a valuable tool for any sales team. Sales dashboard allows you to view and monitor sales indicators that are important for manager and sales staff. It helps to use timely and reliable information to improve the quality of sales performance and increase sales revenues. ConceptDraw Sales Dashboard solution is a tool for both: sales manager and sales team. It provides the visualization of key performance indicators that are critical to the entire sales organization. The custom sales dashboard displays real-time information on sales performance KPIs with the help of intuitive and easy-to-understand diagrams and charts. Sales Dashboard helps the entire team see where they are, and what needs to be done. With ConceptDraw DIAGRAM you can easily create a visual Sales Dashboard using Live Objects Technology.HelpDesk
How to Make a Logistic Dashboard
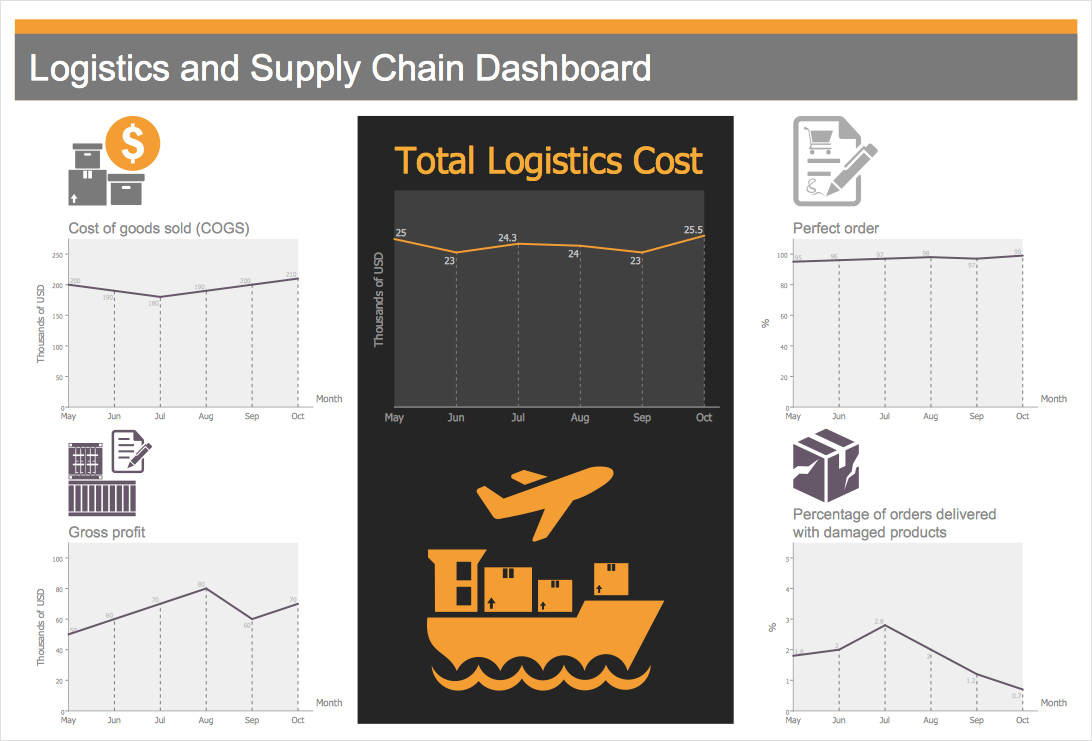
Logistics and supply chain data represented in the view of the dashboard can show the real picture of the logistic management activity of the organization. It can display important logistics KPIs like Supply chain performance measures, warehouse statistics, and more logistics KPIs. The dashboard provides managers, marketers, and analysts to improve the management of financial, informational, internal and external material flows and processes. The logistics dashboard ensures the precise accounting of document and goods turnover, logistics infrastructure and logistic costs. It helps to improve the management of financial, informational, internal and external material flows and processes. Logistics Dashboard Solution for ConceptDraw DIAGRAM allows you to see what information you need from each logistics KPI to see if your logistic process performs fast, accurate and cost-efficient.
 Correlation Dashboard
Correlation dashboard solution extends ConceptDraw DIAGRAM software with samples, templates and vector stencils library with Scatter Plot Charts for drawing the visual dashboard visualizing data correlation.
 PM Dashboards
The PM Dashboards solution extends the management boundaries of ConceptDraw DIAGRAM and ConceptDraw PROJECT products with an ability to demonstrate changes to the budget status, to show the project progress toward its objectives, to display clearly the identified key performance indicator (KPI) or the set of key performance indicators for any project. This solution provides you with examples and ability to generate three types of visual dashboards reports based on your project data Project Dashboard, Tactical Dashboard, and Radar Chart. By dynamically charting the project’s key performance indicators that are collected on one ConceptDraw DIAGRAM document page, all project participants, project managers, team members, team leaders, stakeholders, and the entire organizations, for which this solution is intended, have access to the daily status of projects they are involved in.
 Meter Dashboard
Meter dashboard solution extends ConceptDraw DIAGRAM software with templates, samples and vector stencils library with meter indicators for drawing visual dashboards showing quantitative data.
 Composition Dashboard
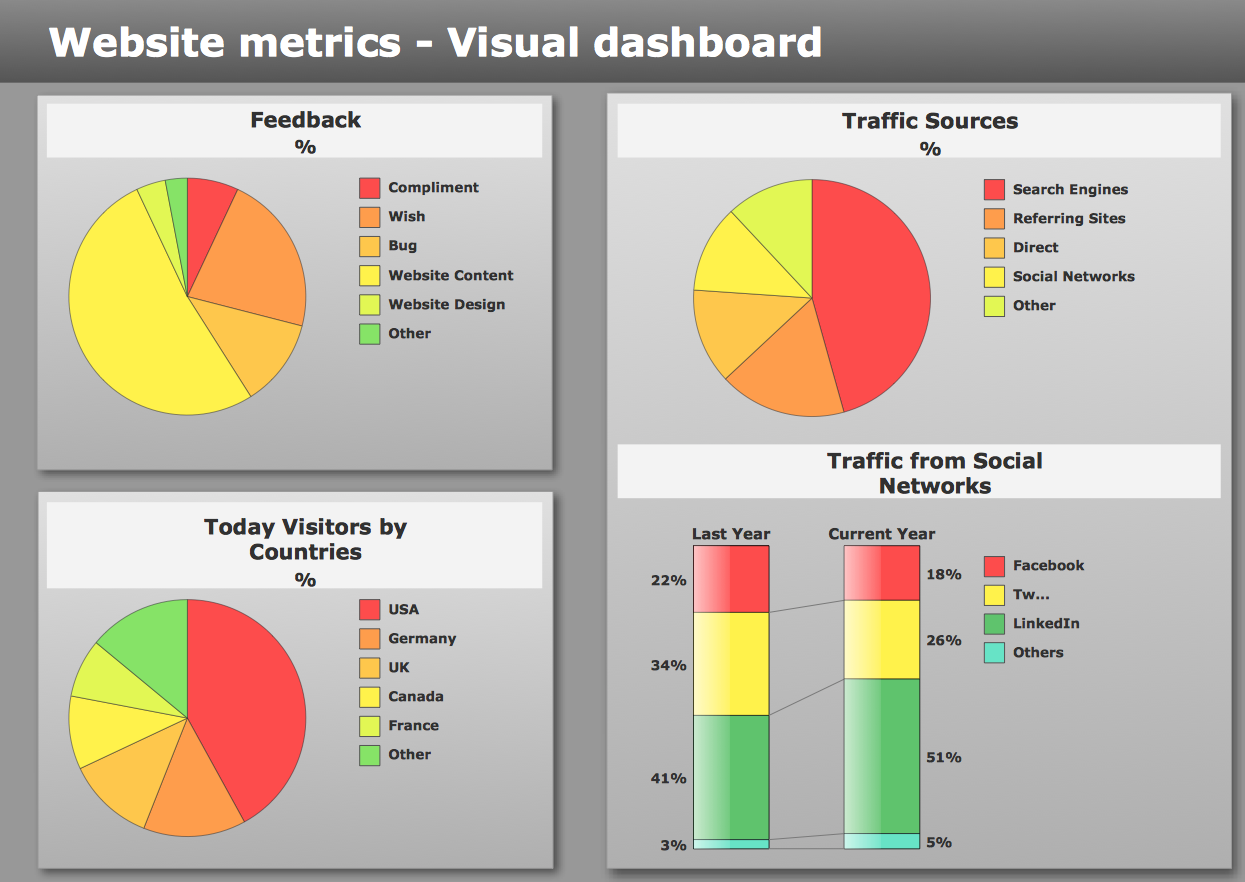
Composition dashboard solution extends ConceptDraw DIAGRAM software with templates, samples and vector stencils library with charts and indicators for drawing visual dashboards showing data composition.
 Logistic Dashboard
The powerful tools of Logistic Dashboard solution and specially developed live graphic objects of logistic icons, logistic navigation elements, logistic indicators, logistic charts and logistic maps effectively assist in designing Logistic dashboards, Logistic maps, Logistic charts, diagrams and infographics. The included set of prebuilt samples and quick-start templates, demonstrates the power of ConceptDraw DIAGRAM software in logistics management, its assisting abilities in development, realization and analyzing the logistic processes, as well as in perfection the methods of logistics management.
- How to Connect a Live Object to a Text Data Source | How to ...
- How to Connect Text Data to a Time Series Chart on Your Live ...
- KPI Dashboard | Sales Dashboard | How to Connect a Live Object to ...
- Time Series Dashboard | How to Connect Text Data to a Time Series ...
- How to Connect a Live Object to a CSV Data Source | How to ...
- How to Connect a Live Object to a Text Data Source | How to ...
- Data Flow Diagram | How to Connect a Live Object to a Text Data ...
- How to Connect a Live Object to a Text Data Source | How to ...
- What is a KPI? | Enterprise dashboard | How to Connect Text Data to ...


