 Fishbone Diagram
Fishbone Diagrams solution extends ConceptDraw PRO software with templates, samples and library of vector stencils for drawing the Ishikawa diagrams for cause and effect analysis.
 Seven Management and Planning Tools
Seven Management and Planning Tools solution extends ConceptDraw PRO and ConceptDraw MINDMAP with features, templates, samples and libraries of vector stencils for drawing management mind maps and diagrams.
PDPC
ConceptDraw PRO extended with Seven Management and Planning Tools Solution from the Management Area of ConceptDraw Solution Park is the best software for drawing all types of diagrams from the Seven Management and Planning Tools: Affinity Diagram, Relations Diagram, Prioritization Matrix, Root Cause Analysis Tree Diagram, Involvement Matrix, PERT Chart, and Risk Diagram (PDPC).Fault Tree Analysis Software
ConceptDraw PRO extended with Fault Tree Analysis Diagrams Solution from the Engineering Area of ConceptDraw Solution Park is the best Fault Tree Analysis Software.First of all, Fault Tree Analysis Diagrams Solution provides a set of samples which are the good examples of easy drawing professional looking Fault Tree Analysis Diagrams.
 ConceptDraw Solution Park
ConceptDraw Solution Park collects graphic extensions, examples and learning materials
Affinity Diagram
The affinity diagram is a business tool used to organize ideas and data. It is one of the Seven Management and Planning Tools. But how design the Affinity Diagram quick and easy? ConceptDraw PRO diagramming and vector drawing software offers the Seven Management and Planning Tools Solution from the Management Area.Prioritization Matrix
You can design the Prioritization Matrix by hand on the paper, but we offer you the most easier way - to use the ConceptDraw PRO diagramming and vector drawing software extended with Seven Management and Planning Tools Solution from the Management Area.PERT Chart
The program (or project) evaluation and review technique, commonly abbreviated PERT, is a statistical tool, used in project management, which was designed to analyze and represent the tasks involved in completing a given project. ConceptDraw PRO diagramming and vector drawing software extended with Seven Management and Planning Tools Solution from the Management Area offers the extensive drawing tools for effective drawing the PERT Chart of any complexity.
 Management Area
The solutions from Management area of ConceptDraw Solution Park collect templates, samples and libraries of vector stencils for drawing the management diagrams and mind maps.
 Seven Management and Planning Tools
Seven Management and Planning Tools solution extends ConceptDraw PRO and ConceptDraw MINDMAP with features, templates, samples and libraries of vector stencils for drawing management mind maps and diagrams.
HelpDesk
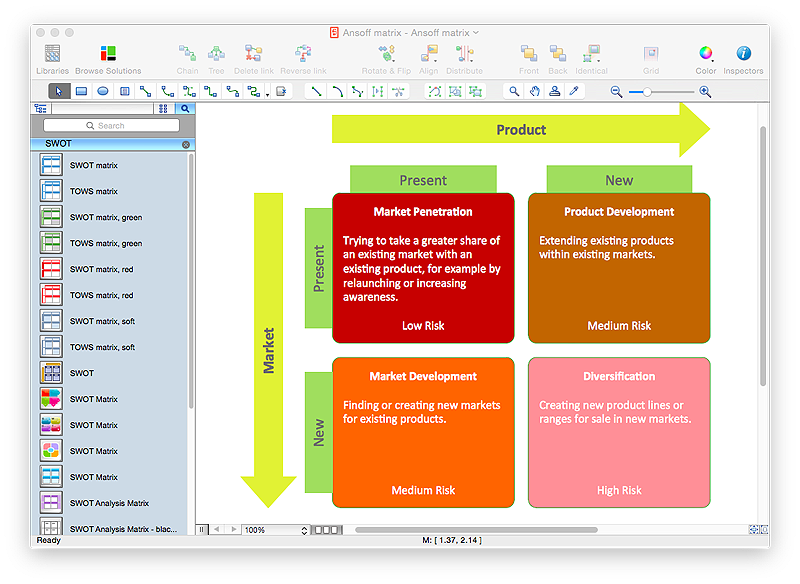
How to Make an Ansoff Matrix Template in ConceptDraw PRO
Ansoff Matrix is a business strategic management tool that helps a business determine its product and market growth strategy. Ansoff matrix has four sections to show each impacting ways that businesses can grow. Using Ansoff Matrix enables determining the current position of any business in the industry and choose the direction of its growth, which would provide the most competitive position. While Ansoff Matrix is most commonly used as a business planning tool it can be used also for personal development. You can make Ansoff Matrix template for your organization using ConceptDraw PRO Matrices solution.
 Concept Maps
The technique of concept mapping was developed as a constructive way of representing knowledge in science and increasing the meaningfulness of learning. Now, the creation of a concept map is extremely helpful when used in education as learning and teaching techniques that assist memorization. Concept maps are also used for idea generation in brainstorming sessions, and for detailing the structure of complex ideas.
- Cause and Effect Analysis ( Fishbone Diagrams) | PROBLEM ...
- Cause and Effect Analysis ( Fishbone Diagrams) | TQM Diagram ...
- Seven Management and Planning Tools | Fishbone Diagram ...
- Using Fishbone Diagrams for Problem Solving | Concept map - Risk ...
- Cause and Effect Analysis ( Fishbone Diagrams)
- Cause and Effect Analysis ( Fishbone Diagrams) | Business ...
- Bar Diagrams for Problem Solving. Create manufacturing and ...
- Marketing Analysis Diagram | Flowchart Example: Flow Chart of ...
- Software for Creating SWOT Analysis Diagrams | Seven ...
- Decision Making | PROBLEM ANALYSIS Prioritization Matrix | Risk ...
- Fishbone Diagram | Cause and Effect Analysis ( Fishbone Diagrams ...
- SWOT Analysis Tool for Small Business | Total Quality Management ...
- Cause and Effect Analysis ( Fishbone Diagrams) | Cause & Effect ...
- How To Create Emergency Plans | SWOT analysis diagram ...
- Decision Making | Block diagram - Customer decision making | Work ...
- Cause and Effect Analysis ( Fishbone Diagrams) | Cause & Effect ...
- Venn Diagram Examples for Problem Solving. Environmental Social ...
- Fault Tree Analysis Diagrams | Fault Tree Diagram | Fault Tree ...
- Root Cause Analysis | Decision Making | PROBLEM ANALYSIS ...
- Seven Management and Planning Tools | TQM Diagram ...


