 Total Quality Management TQM Diagrams
Total Quality Management Diagrams solution extends ConceptDraw PRO software with samples, templates and vector stencils library for drawing the TQM flowcharts.
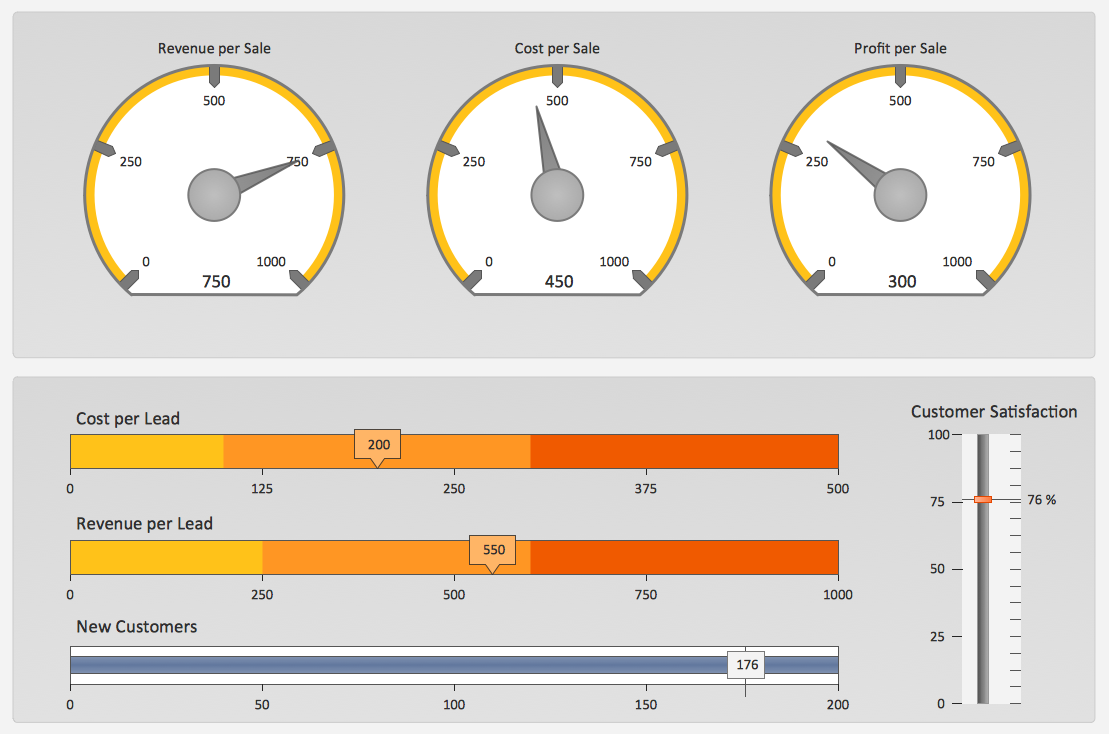
Sales Dashboard Solutions can help your sales team keep an eye on performance
ConceptDraw Sales Dashboard Solution is a simple and effective way of visualizing sales data and get clear picture of your sales process to see how your business can improve.Sales Dashboards for Your Company
ConceptDraw PRO software extended with the Sales Dashboard solution allows you produce sales dashboards for your company easily. You can start from samples and templates delivered with the solution and then modify them to get a dashboard that suites your specific needs.Constant improvement of key performance indicators
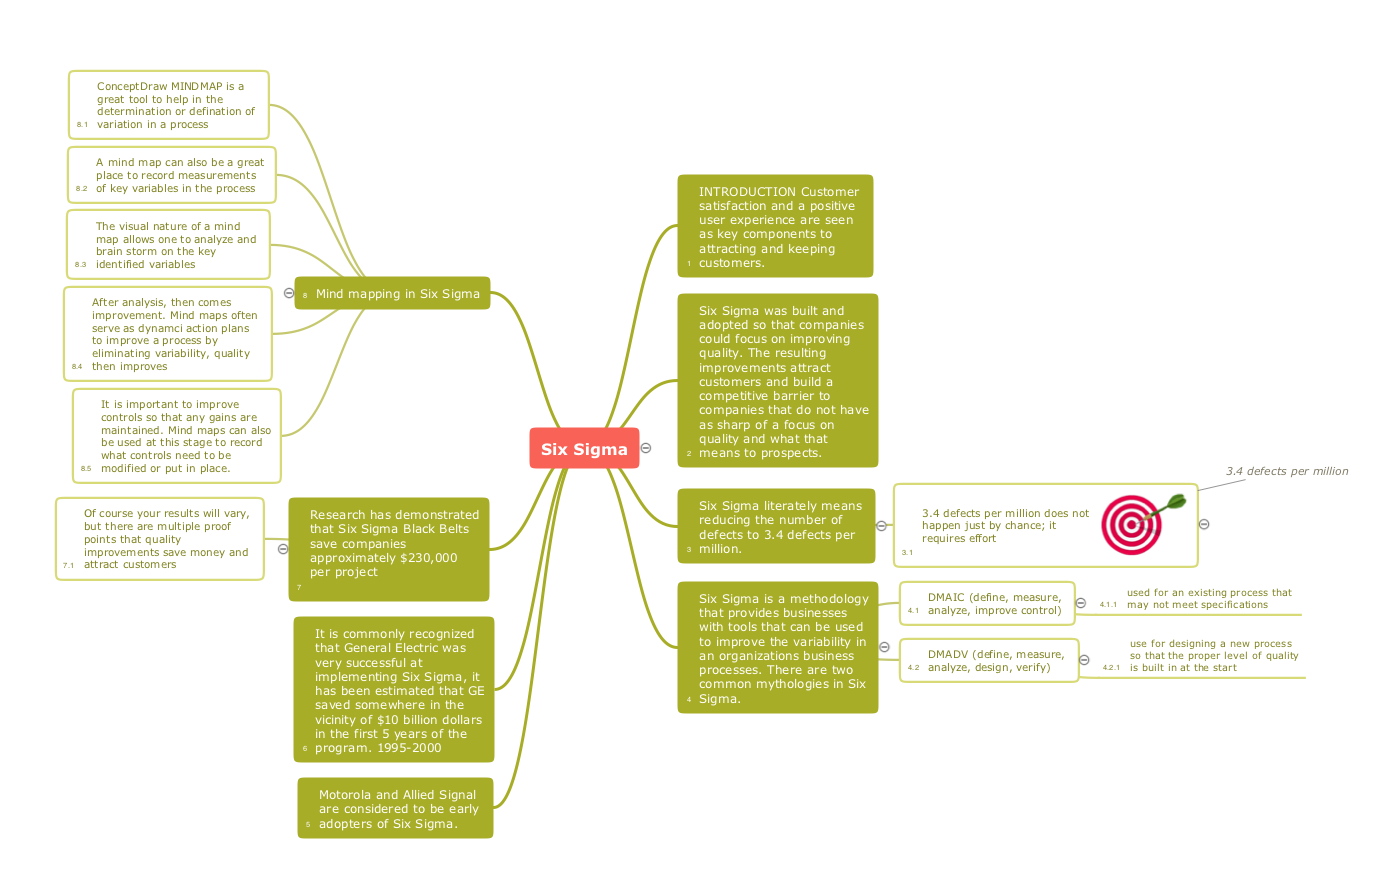
There are available tool to lend a fresh look to quality procedures - ConceptDraw MINDMAP.How To Create Project Report
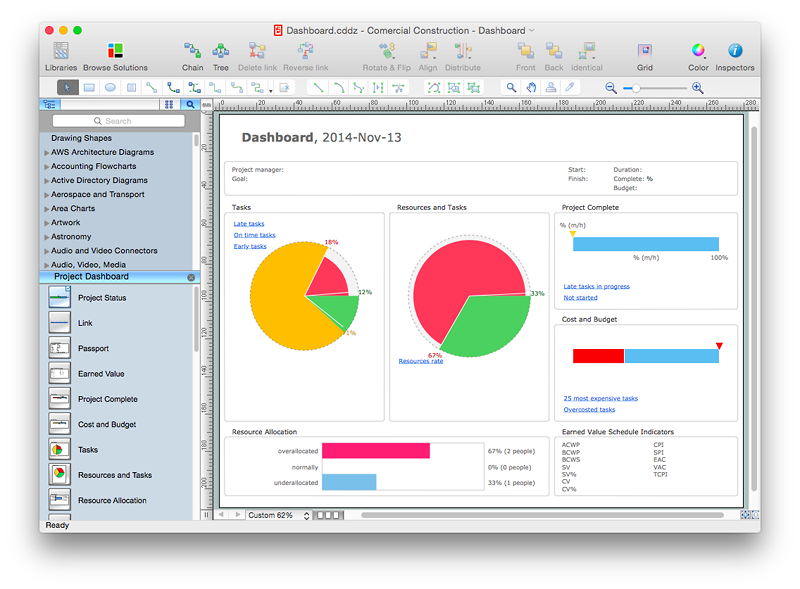
ConceptDraw PROJECT contains an extensive tool set to help project managers. The rich data visualization capability that is provided by ConceptDraw products helps you create project dashboards, one-click reports, multi-project views, Gantt charts, and resource views. Let′s learn how to get maximum value using ConceptDraw PROJECT!Performance Indicators
ConceptDraw PRO diagramming and vector drawing software offers the useful tools of the Sales Dashboard solution from the Marketing area for easy creating professional looking live dashboards which allow to track the business sales activity and progress thanks to representing the Key Performance Indicators (KPIs) on them.TQM Diagram Example
The Total Quality Management Diagram solution helps you and your organization visualize business and industrial processes. Create Total Quality Management diagrams for business process with ConceptDraw software.HelpDesk
How to Create Project Dashboard on Mac
The visual Project Dashboard within ConceptDraw Office is the best way to deliver a clear view of project performance to all project participants.
 Spatial Dashboard
Spatial dashboard solution extends ConceptDraw PRO software with templates, samples and vector stencils libraries with thematic maps for drawing visual dashboards showing spatial data.
 Sales Dashboard
Sales Dashboard solution extends ConceptDraw PRO software with templates, samples and library of vector stencils for drawing the visual dashboards of sale metrics and key performance indicators (KPI).
 Business Intelligence Dashboard
Business Intelligence Dashboard solution extends the ConceptDraw PRO v11 functionality with exclusive tools, numerous ready-to-use vector objects, samples and quick-start templates for creation professional Business Intelligence Dashboards, Business Intelligence Graphics, Business Intelligence Charts and Maps of different kinds. Design easy the BI dashboard, BI model or Dynamic chart in ConceptDraw PRO to monitor the company's work, to track the indicators corresponding your company's data, to display and analyze key performance indicators, to evaluate the trends and regularities of the processes occurring at the company.
 Correlation Dashboard
Correlation dashboard solution extends ConceptDraw PRO software with samples, templates and vector stencils library with Scatter Plot Charts for drawing the visual dashboard visualizing data correlation.
 Status Dashboard
Status dashboard solution extends ConceptDraw PRO software with templates, samples and vector stencils libraries with graphic indicators for drawing the visual dashboards showing status data.
 Composition Dashboard
Composition dashboard solution extends ConceptDraw PRO software with templates, samples and vector stencils library with charts and indicators for drawing visual dashboards showing data composition.
 Comparison Dashboard
Comparison dashboard solution extends ConceptDraw PRO software with samples, templates and vector stencils library with charts and indicators for drawing the visual dashboard comparing data.
- Quality Dashboard Template
- Quality Dashboards
- Key Performance Indicators In Tqm
- Status Dashboard | TQM Diagram — Professional Total Quality ...
- PM Dashboards | TQM Diagram — Professional Total Quality ...
- KPI Dashboard | TQM Diagram Example | Business Graphics ...
- Business Report Pie. Pie Chart Examples | Sales Dashboards for ...
- Constant improvement of key performance indicators | TQM Diagram ...
- Constant improvement of key performance indicators | TQM Diagram ...
- Constant improvement of key performance indicators | TQM Diagram ...
- Performance Indicators | Meter Dashboard | Lean Six Sigma ...
- KPIs and Metrics | Design elements - Sales KPIs and metrics | TQM ...
- KPIs and Metrics | Business Intelligence Dashboard | Competitor ...
- Total Quality Management | Management Tools — Total Quality ...
- Probability Quality Control Tools | TQM Diagram — Professional ...
- AWS Architecture Diagrams | Flowcharts | TQM Diagram ...
- TQM Diagram Example | Best Value — Total Quality Management ...
- Constant improvement of key performance indicators | Performance ...
- Definition TQM Diagram | Sales Process Flowchart. Flowchart ...


